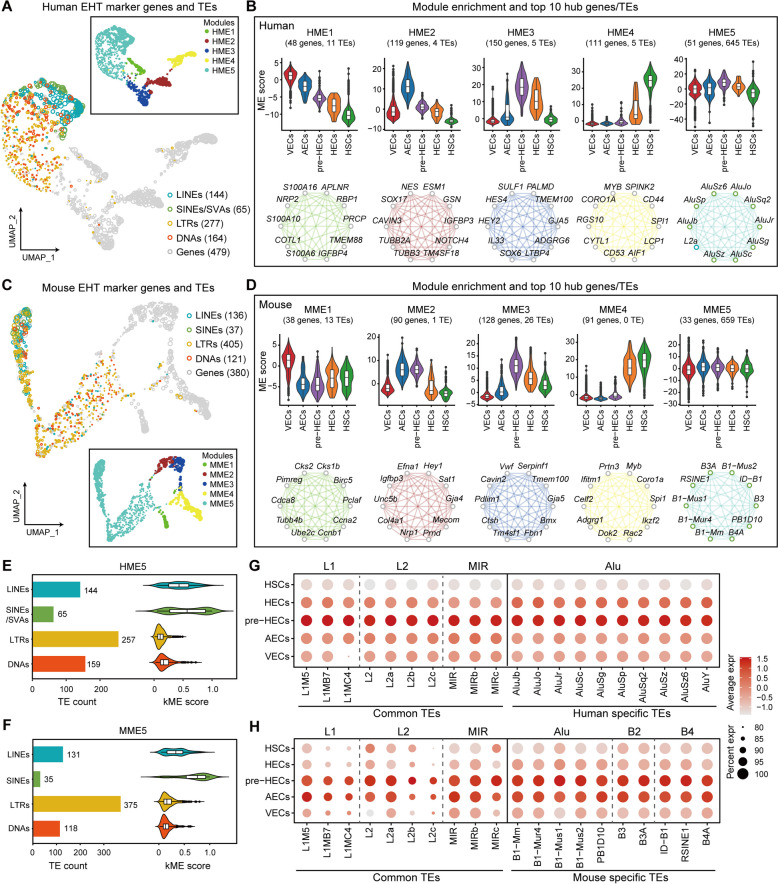
Fig. 3.
Co-expression network analysis of marker genes and expressed TEs. A, C Co-expression modules of marker genes and TEs in human and mouse. Most TEs tend to cluster together as distinct modules (HME5 and MME5). B, D The expression patterns and top 10 hub genes/TEs of each module in human and mouse. TEs show a common upregulation trend in pre-HECs. In the case of mouse, this upregulation appears to occur even earlier, during the AEC stage. E, F TE composition (bar plot) and module connectivity (kME, violin plot) of HME5 and MME5. G, H Dot plots show the expression levels of selected common and species-specific TEs

