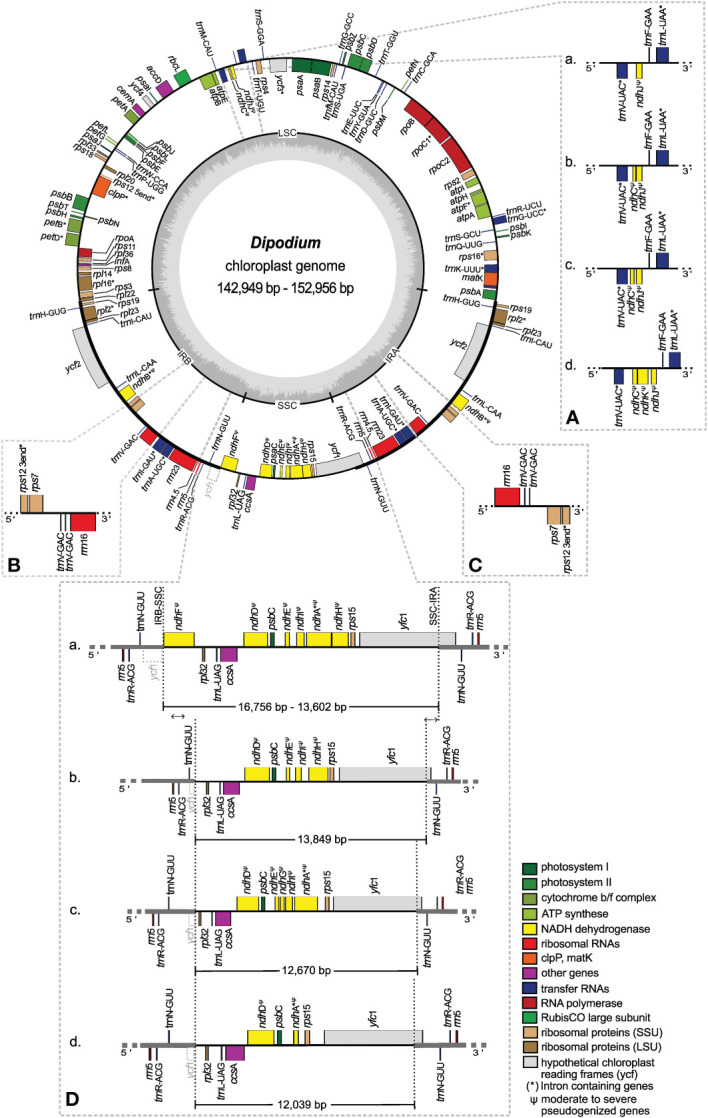
Figure 5.

Plastome map and boundary shifts in Dipodium. The plastome of D. atropurpureum 2 is illustrated as representative and shown as a circular gene map with the smallest and the largest Dipodium plastome of this study. Genes outside the circle are transcribed in a clockwise direction, and those inside the circle are transcribed in a counterclockwise direction. The dark grey inner circle corresponds to the G/C content, and the lighter grey corresponds to the A/C content. The major distinct regions of complete Dipodium plastomes are compared in each detailed enlarged box (A–D). (A) Note that each representative block (A–D) has pseudogenised or lost ndhJ, ndhK, or ndhC gene. (B, C). Duplication of trnV-GAC in the inverted repeat regions of D. interaneum (IRB), D. hamiltonianum (IRA), D. elegantulum (IRB), D. stenocheilum 2 (IRA), and D. ammolithum (IRA). (D) Each block (A) as representative D. roseum 2; (B) D. pandanum 1; (C) D. stenocheilum 1; (D) D. variegatum) shows differences in the length (bp) of the SSC region caused through loss or pseudogenisation of ndhF, ndhD, ndhE, ndhG, ndhI, ndhA, or ndhH; note the boundary shift of the IRs/SSC region caused through the loss/pseudogenisation of ndhF and the inclusion of the functional ycf1 and the ycf1 fragment (grey, dashed line) into the IRs. SSC, small single copy; LSC, large single copy, IRA/B, inverted repeat A/B.
