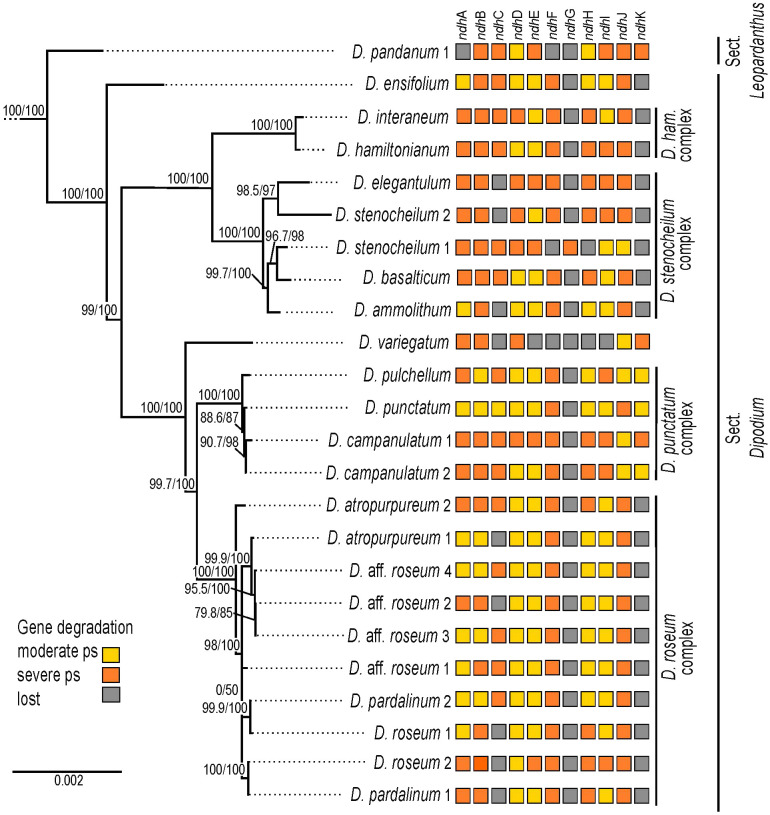
Figure 6.
Pattern of putative ndh gene degradation in Dipodium. Gene degradation plotted against the maximum likelihood tree with focus on 24 fully assembled plastomes (outgroups not shown). Support values (SHaLRT/UFboot) are shown on each branch. ps, pseudogenisation; D. ham., Dipodium hamiltonianum.

