Figure 1.
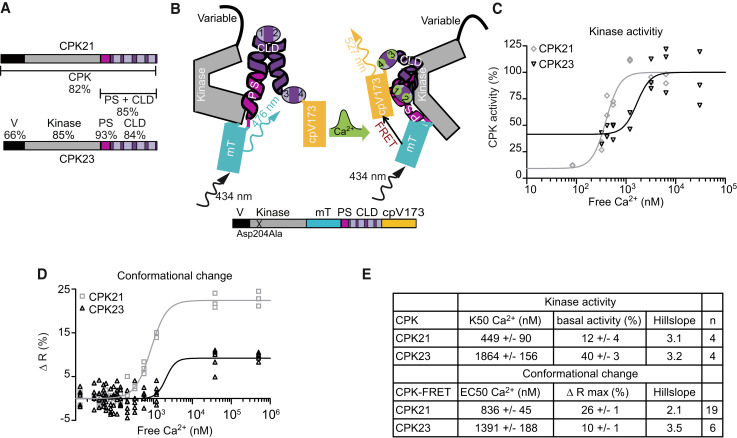
CDPK-FRET reports isoform-specific Ca2+-dependencies of conformational changes of CDPKs. A) Schematic diagrams of CPK21 and CPK23 displaying the variable domain (V), kinase domain (Kinase), pseudosubstrate segment (PS) and calmodulin-like domain (CLD) containing four EF-hand motifs (bright boxes). Numbers indicate the percentage of identical amino acids between CPK21 and CPK23. B) Schematic diagram of CDPK-FRET, mTurquoise (mT) and cpVenus173 (cpV173) sandwiching CPK PS-CLD. The conformation change in CDPK-FRET following Ca2+-binding is shown in the transition from the left model to the right. Ca2+-binding brings mT and cpV173 into close proximity, allowing for the detection of this conformation change via FRET. C) In vitro kinase activity using CPK21 and CPK23 proteins expressed and purified from E. coli with a peptide of SLAC1 as substrate in the presence of increasing amounts of Ca2+ (R2CPK21 = 0.91, R2CPK23 = 0.76, K50CPK21 = 397 nM Ca2+, K50CPK23 = 1,656 nM Ca2+). Activity is expressed as a percentage of activity at full Ca2+-saturation. One representative experiment is shown. For each of the 7 Ca2+-concentrations, purified enzyme was added to 2–3 premixed reaction mixtures resulting in 2–3 technical replicates. D) In vitro FRET-recorded conformational changes of CPK21- and CPK23-FRET fusion proteins expressed and purified from E.coli are plotted against Ca2+-concentration (R2CPK21 = 0.98, R2CPK23 = 0.69, EC50CPK21 = 857 nM Ca2+, EC50CPK23 = 2,095 nM Ca2+). The best fit-value obtained for the bottom or base level of FRET emission ratio was used to calculate changes in emission ratio [Δ R (%)]. Therefore, Δ R is given as the percentage increase in ratio over the base level of FRET emission ratio. One representative experiment is shown. For each of the 15 Ca2+-concentrations, purified CDPK-FRET fusion protein was combined with the corresponding Ca2+ buffer at 1:1 dilution in 3–6 technical replicates. E) Summary of half-maximal kinase activity (K50) and half-maximal effective concentration (EC50) of conformational change in n independent experiments; ‘n’ refers to the number of experiments (mean ± SEM). The Hill slope is fitted as a shared value for all data sets of the same enzyme.

