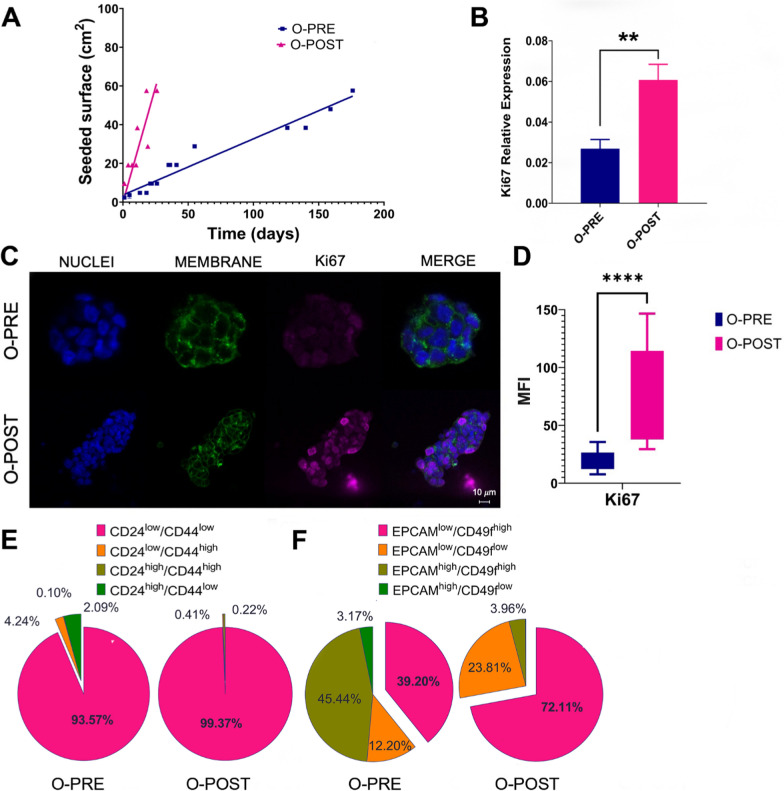
Fig. 2.
Differences in the proliferation rate and EMT potential between O-PRE and O-POST. A Growth curves of O-PRE and O-POST cultures (N = 2–3). (B-D) Characterization of O-PRE and O-POST by qRT‒PCR (B) and confocal microscopy analyses (C, D) of Ki67 expression. Box plot analysis showing the Ki67 expression levels, evaluated as the relative expression of Ki67 (B) and as the mean fluorescence intensity (MFI) (C-D), obtained from image quantification of O-PRE and O-POST cultures. ****p < 0.0001. Representative images of Ki67 immunofluorescence staining are shown in Panel C. Nuclei (blue, DAPI), membrane (green, WGA FITC) and Ki67 (pink, Anti-Rb AF546) are labelled. Scale bar = 10 µm. E O-PRE and O-POST were evaluated by multiparametric flow cytometry for the cell surface markers CD24 and CD44. F O-PRE and O-POST were analysed by multiparametric flow cytometry for the expression of EPCAM and CD49f markers

