Fig. 1.
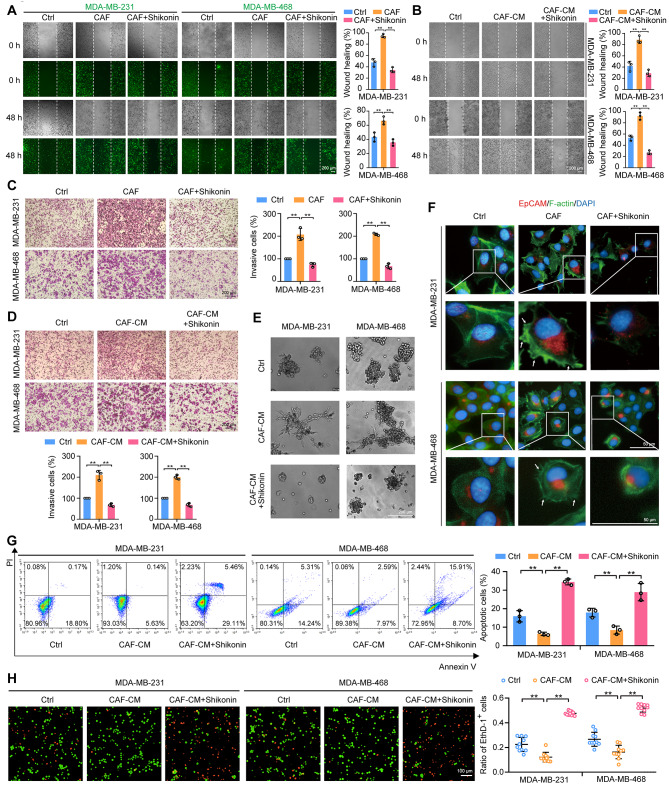
Shikonin inhibits CAF-stimulated metastatic potential of TNBC cells. (A) Cell migration ability was measured by the wound-healing assay. TNBC cells (stained with CellTracker™ Green, green fluorescence) were co-cultured with CAFs at a ratio of 2:1 and treated with or without shikonin (2 μM) for 48 h. Images were captured at 0 and 48 h post-wounding (magnification, ×50; scale bars, 200 μm, n = 3). (B) Cell migration was measured by wound-healing assay. TNBC cells were treated with CAF-CM in the presence or absence of shikonin (2 μM) for 48 h. Images were captured at 0 and 48 h post-wounding (magnification, ×50; scale bars, 200 μm, n = 3). (C) Cell invasion was measured by Transwell assay. TNBC cells were pretreated with shikonin (2 μM) for 6 h and then inoculated in the upper compartment, and CAFs were inoculated in the lower compartment. TNBC cells and CAFs were cocultured for 24 h and images were captured (magnification, ×100; scale bars, 200 μm, n = 3). (D) Cell invasion was measured by Transwell assay. TNBC cells were treated with CAF-CM in the presence or absence of shikonin (2 μM) for 48 h. Images were captured (magnification, ×100; scale bars, 200 μm, n = 3). (E) TNBC cells grown in Matrigel. TNBC cells were treated with CAF-CM in the presence or absence of shikonin (2 μM) for 3 days (magnification, ×50; scale bars, 200 μm). (F) Immunofluorescence staining of TNBC cells labeled with anti-EpCAM antibody (red fluorescence), F-actin (green fluorescence), and DAPI (blue fluorescence). TNBC cells were co-cultured with CAFs at a ratio of 2:1 and treated with or without shikonin (2 μM) for 48 h. Arrows indicate filopodia and lamellipodia (magnification, ×400; scale bars, 50 μm). Cells were treated with or without shikonin (2 μM) in the presence or absence of CAF-CM for 48 h. (G, H) Anoikis of TNBC cells was detected by Annexin V-fluorescein isothiocyanate/propidium iodide (PI) double staining (G; n = 3) or calcein AM/ethidium homodimer (EthD-1) staining (H; magnification, ×200; scale bars, 100 μm; n = 10). Data are presented as mean ± SD. **p < 0.01

