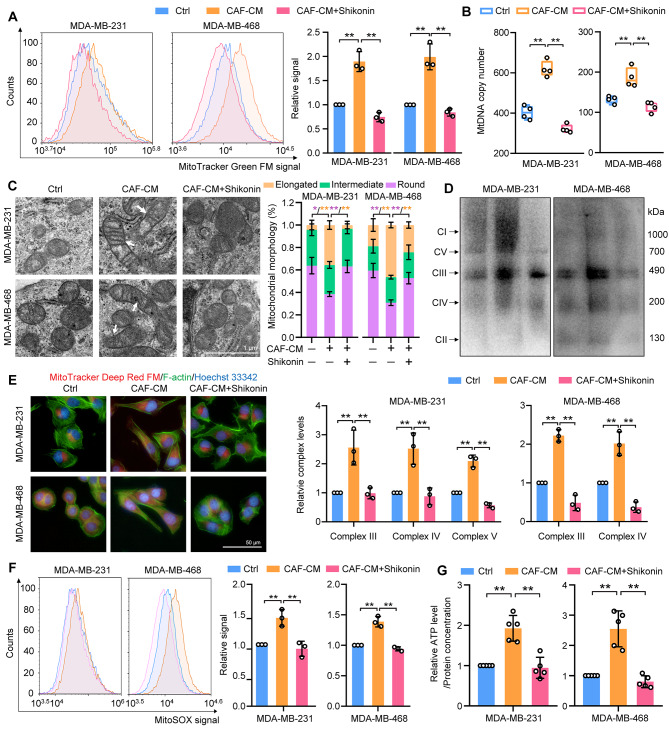
Fig. 2.
Shikonin modulates mitochondrial biogenesis in TNBC cells in response to CAF stimulation. Cells were treated with CAF-CM in the presence or absence of shikonin (2 μM) for 48 h. (A) Mitochondria were visualized using MitoTracker Green staining and analyzed by flow cytometry (n = 3). (B) Evaluation of mtDNA levels relative to ND1 and ND5, compared with SLCO2B1 and SERPINA1 as controls (n = 4). (C) Transmission electron microscopy depicting mitochondrial morphology in TNBC cells (magnification ×15 000; scale bar, 1 μm). Quantification of mitochondria with different morphologies is shown (n = 5). (D) Detection of mitochondrial complexes using native polyacrylamide gel electrophoresis and a mitochondrial antibody cocktail. The quantification of the data was represented by the fold-changes compared to the control groups (n = 3). (E) Visualization of mitochondrial distribution using MitoTracker Deep Red FM (red fluorescence, mitochondria), Alexa Fluor 488™ phalloidin (green fluorescence, F-actin), and Hoechst33342 (blue fluorescence, nucleus) staining (magnification, ×400; scale bars, 50 μm). (F) Assessment of mitochondrial reactive oxygen species (ROS) levels using MitoSOX labeling flow cytometry (n = 3). (G) ATP content in cellular extracts was calculated using an ATP detection kit. Intracellular ATP levels were normalized to the protein concentration (n = 5). Data are presented as mean ± SD. *p < 0.05, **p < 0.01

