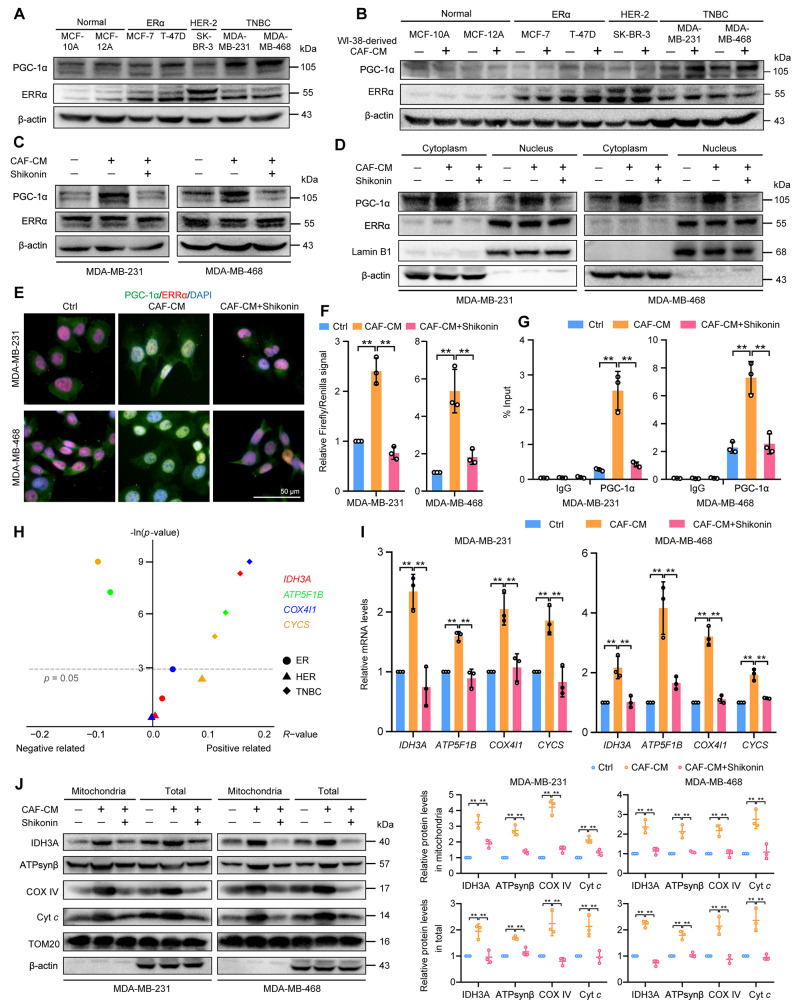
Fig. 3.
Shikonin modulates the CAF-induced PGC-1α/ERRα axis in TNBC cells. The culture medium from different subtypes breast cancer cells was used to activate WI-38 cells for 48 h, stimulating them to transform into CAFs. Then CAF-CM from activated WI-38 cells was used to induce breast cancer cells for 48 h in both (A) and (B). (A) Expression of PGC-1α and ERRα in different breast cancer cell types. (B) Expression of PGC-1α and ERRα in different breast cancer cell types after WI-38 cell transformed CAF-stimulation. TNBC cells were treated with CAF-CM in the presence or absence of shikonin (2 μM) for 48 h: (C)-(F). (C) PGC-1α and ERRα expression in TNBC cells. (D) Cytoplasmic and nuclear distributions of PGC-1α and ERRα in TNBC cells. Lamin B1 and β-actin were used as endogenous references for nuclear fractions and cytosolic lysates, respectively. (E) Cellular localization of PGC-1α and ERRα in TNBC cells detected by immunofluorescent staining (magnification, ×400; scale bars, 50 μm). (F) Transcriptional activity of ERRα in TNBC cells. TNBC cells were transfected with the pRL Renilla luciferase vector (pRL-TK) and the ERRE-luciferase reporter plasmid (pGL3-3×ERRE) at 1:10 (n = 3). (G) ERRα target promoter occupancy in TNBC cells evaluated using chromatin immunoprecipitation-RT-PCR with a PGC-1α antibody (n = 3). (H) Correlation between PPARGC1A and ERRα-targeted genes (IDH3A, ATP5F1B, COX4I1, CYCS) in breast cancer specimens from different breast cancer subtypes. The correlations were evaluated using R-value and p-value which were calculated by Pearson correlation analysis. The results were represented using R script (v.4.0.2) and ggplot2 package. The p-value was transformed to –ln (p-value). PPARGC1A: 219195_at; IDH3A: 202070_s_at, ATP5F1B: 211755_s_at; COX4I1: 213758_at; CYCS: 208905_at. (I) mRNA levels of IDH3A, ATP5F1B, COX4I1, and CYCS were detected using RT-PCR. Results were normalized to ACTB mRNA levels and reported as fold-change compared with control cells (n = 3). (J) Protein levels of IDH3A, ATPsynβ, COX IV, and Cyt c in mitochondria and total cells detected by western blotting. TOM20 and β-actin were used as endogenous references for mitochondrial fractions and total lysates, respectively. Data are presented as mean ± SD (n = 3). **p < 0.01

