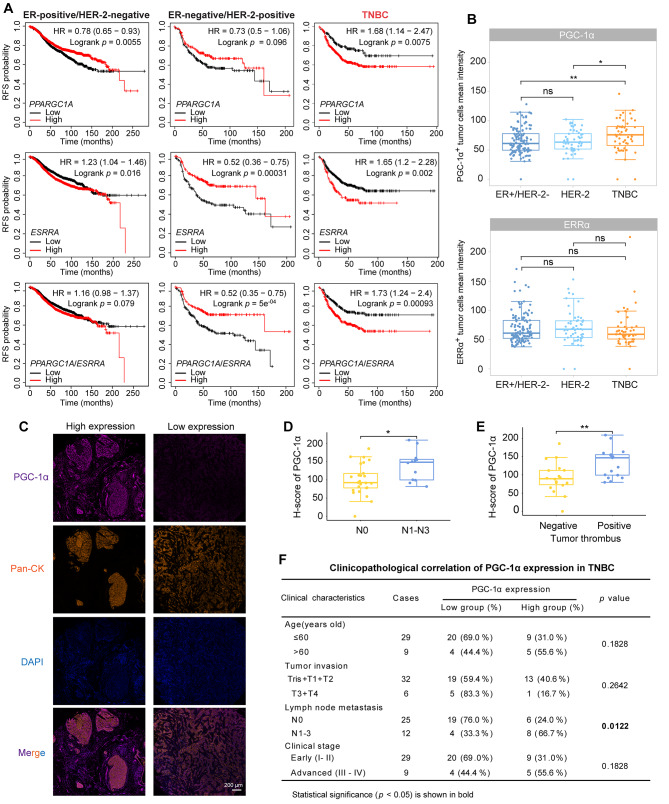
Fig. 7.
Correlation of high PGC-1α expression with poor prognosis in TNBC. (A) Associations between PPARGC1A, ESSRA and PPARGC1A/ESSRA mRNA levels and RFS in patients with different subtypes of breast cancer using Kaplan–Meier plotter analysis. PPARGC1A and ESSRA mRNA levels were categorized as high or low using the auto-select best cutoff mode. The PPARGC1A/ESSRA mRNA level was defined as high or low using the mean expression of selected genes. PPARGC1A: 219195_at; ESSRA: 203193_at. The log-rank test was employed. (B) The mean intensity of PGC-1α-positive and ERRα-positive tumor cells in different breast cancer subtypes. A Wilcoxon test was used. (C) Representative images of PGC-1α expression in TNBC tissues by multiplex immunofluorescence staining. Tissues were labeled with anti-PGC-1α antibody (purple), anti-Pan-CK antibody (orange), and DAPI (blue). (D) High PGC-1α expression correlation with lymph node metastasis status (n = 37). An unpaired two-sided t-test was used. (E) High PGC-1α expression correlation with tumor thrombus formation (n = 35). An unpaired two-sided t-test was used. (F) Clinicopathological correlation of PGC-1α expression in TNBC. χ2 test was used. *p < 0.05, **p < 0.01, ns: not significant

