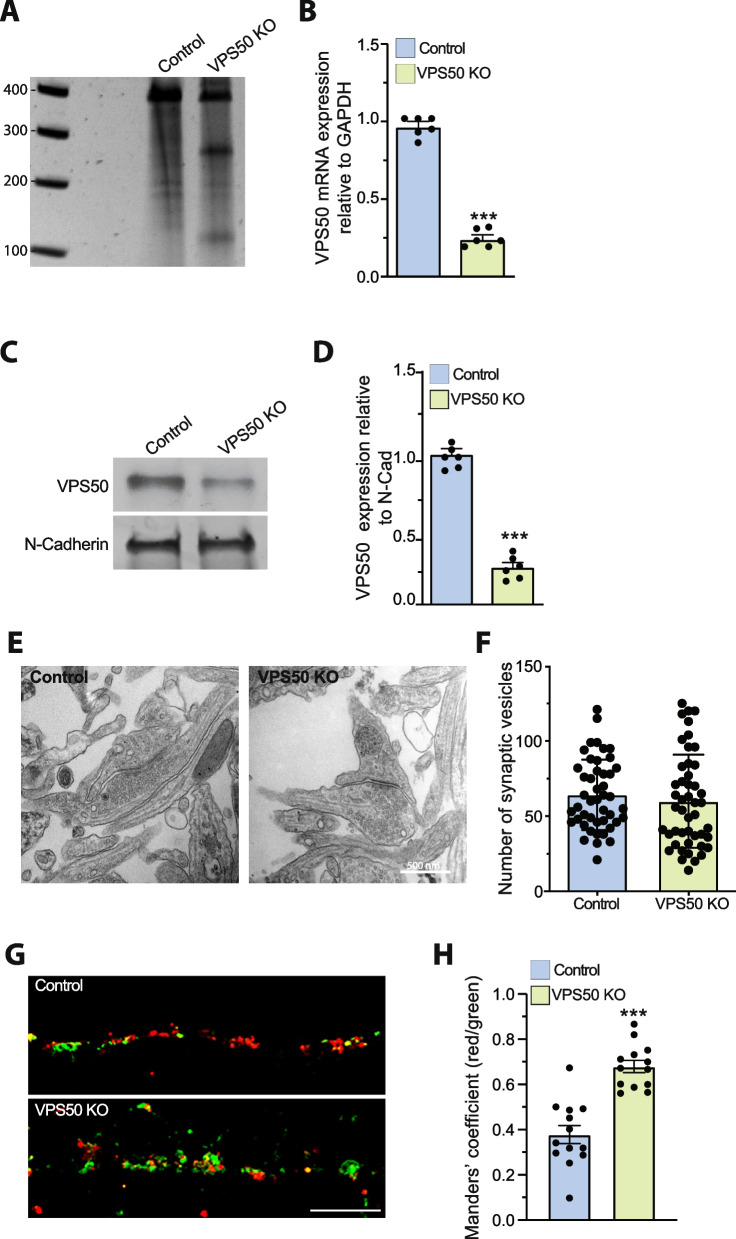
Fig. 1.
VPS50 gene editing causes a decrease in synaptic vesicle acidification but no change in synaptic vesicle number. Cortical neurons from Cas9KI mice were transduced with sgRNA targeting VPS50 at 3 DIV to produce VPS50 KO. A T7 endonuclease I assay of control or VPS50 KO cortical neurons. B RT-qPCR to quantify relative mRNA expression of VPS50. C VPS50 protein expression in VPS50 KO and control neurons. N-cadherin was used as loading control. D Quantification of VPS50 expression in western blots (n = 6 biological replicates). E, F Representative images of synaptic terminals as visualized by electron microscopy and quantification of the number of synaptic vesicles in control and VPS50 KO neurons (n = 50 cells per condition from 3 independent experiments). G Representative images of the Ratio-SyPhy signal used to determine synaptic vesicle acidification in control and VPS50 mKO neurons. Red signal shows all synaptic vesicles and green signal shows vesicles with basic pH. H Quantification of Ratio-SyPhy signal showing Mander’s coefficient. Thirteen samples from 3 biological replicates were used for Ratio-SyPhy quantification. Scale bar: 400 nm (E); 25 μm (G). Unpaired t-test was used for statistical analysis; ***p < 0.001. Error bars represent ± SEM. ***p < 0.001

