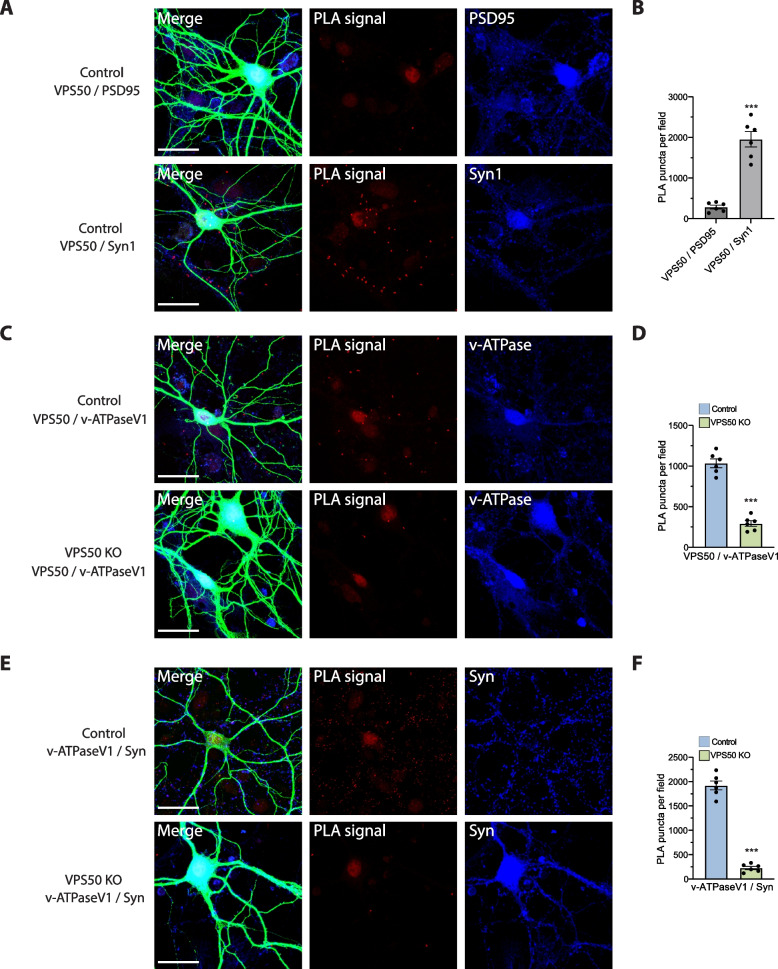
Fig. 2.
VPS50 KO causes mislocalization of v-ATPaseV1 domain in cortical neurons. Proximity-ligation assays (PLAs) was used to determine proximity between studied proteins as indicated in each case. A positive PLA signal, thus proximity between the proteins, is observed as red puncta in images (red channel, 546 nm). In all experiments, an antibody against the microtubule-associated protein 2 (MAP2) was used to stain processes of all neurons (green channel, 488 nm). Merge shows superimposed images of MAP2 (green), PLA signals (red), and the signal for a protein of interest as shown in the figure (blue, 633 nm). A PLA using PSD95 or Synapsin1 (Syn1) antibodies to define pre- or post-synaptic localization of VPS50 in control neurons. B Quantification of PLA puncta per field of VPS50/PSD95 and VPS50/Syn1. C PLA to assess proximity of VPS50 and v-ATPAseV1 domain in control and VPS50 KO neurons. D Quantification of PLA puncta per field of VPS50/v-ATPaseV1 in control and VPS50 KO neurons. E PLA to determine proximity of v-ATPaseV1 domain and Synaptophysin (Syn) in control and VPS50 KO neurons. F Quantification of PLA puncta per field of v-ATPaseV1 domain/Syn in Control and VPS50 KO neurons. Six low magnification (20 ×) fields from 3 independent biological samples were used for quantification in each condition. Scale bars, 25 μm. Unpaired t-test was used for statistical analysis; ***p < 0.001. Error bars represent ± SEM

