Fig. 4.
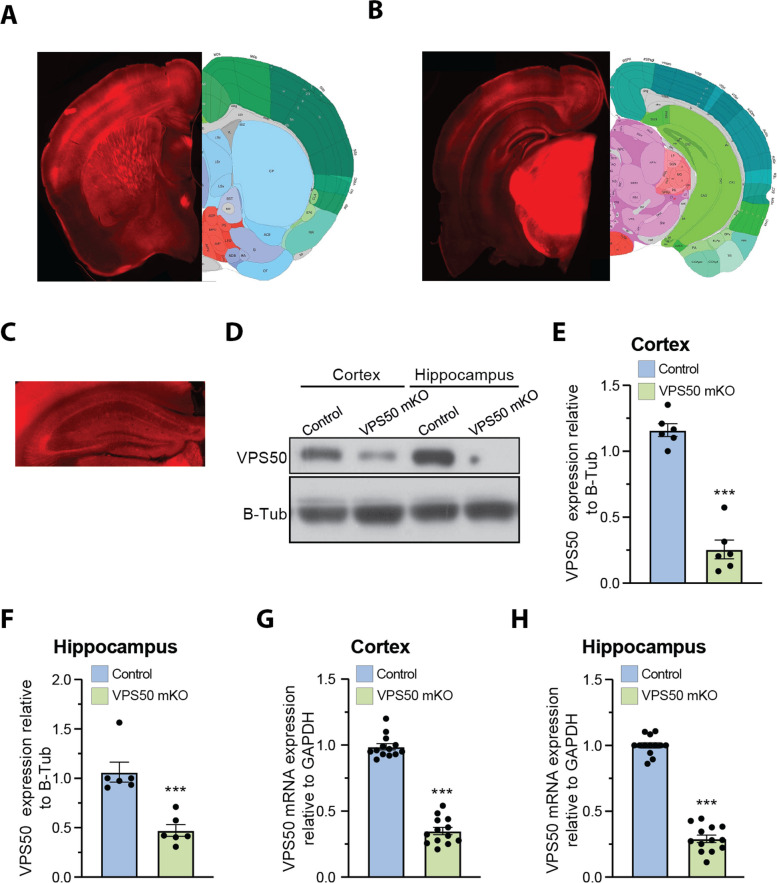
Systemic injection of AAV at P1 to produce VPS50 mKO. A, B Representative image of coronal sections of a mouse brain (VPS50 mKO) injected at P1 with AAV after 15 weeks to show infection efficiency by tdTomato fluorescent signal. Two different sections are shown to show broad infection. A, B (right) Anatomical annotations from the Allen Reference Atlas – Mouse Brain (atlas.brain-map.org), at the same slice position as A and B (left). Scheme of the relative positions are shown to identify brain areas. C Higher magnification image of a hippocampus section showing transduction efficiency. D Representative western blot analyses for the detection of VPS50 expression in control and VPS50 mKO animals in both cortex and hippocampus. B-tubulin was used as loading control. E, F Quantification of VPS50 expression in western blots from cortex (E) or hippocampus (F) n = 6 animals per condition. G, H RT-qPCR to quantify expression of VPS50 in cortex (G) or hippocampus (H), n = 13 animals per condition. Scale bar, 500 μm. Unpaired t-test was used for statistical analysis; ***p < 0.001. Error bars represent ± SEM

