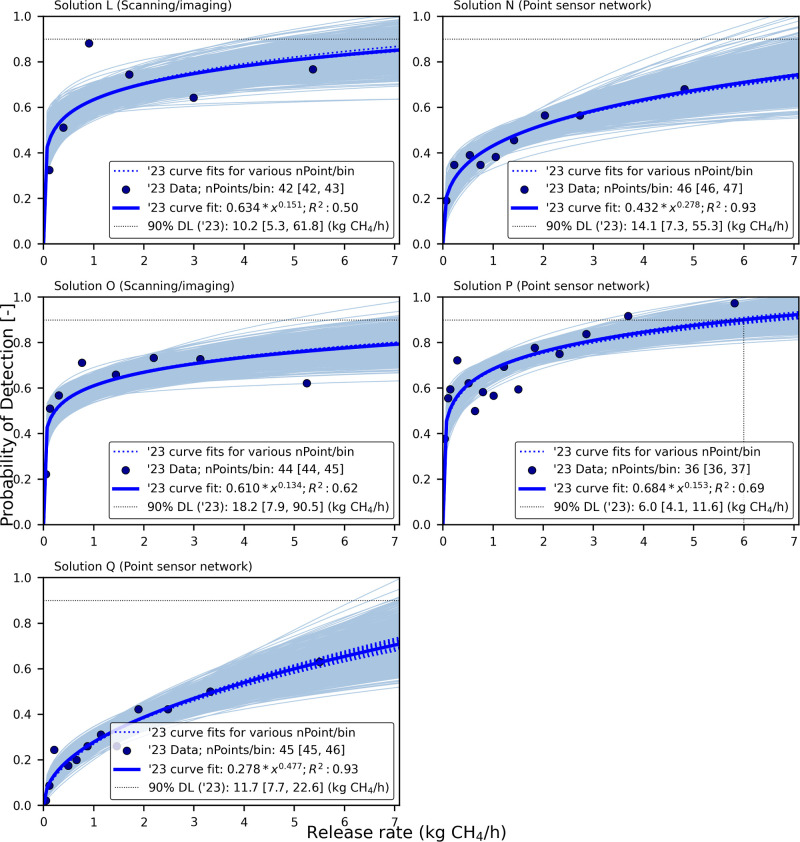
Figure 2.
POD versus emission rate (kg CH4/h) for solutions L, N, O, P, and Q fitted using power function. Solution N, P, and Q are point sensor networks, while solution L and O is a scanning/imaging solution. The x-axis of each plot is divided into equal-sized bins, with each marker (pod) calculated as the fraction of controlled releases in a bin classified as true positives. Each pod data point is bootstrapped to produce a cloud of curves illustrating associated uncertainty. When the bootstrapping could not evaluate the lower and upper empirical CL on the best estimate of a solution’s DL90, they are given as 0 and NA, respectively. Curve fits (dotted colored lines) obtained using other quantile-based discretizations are shown for comparison. Emission rate at which the POD reaches 90% is indicated as the method DL90 for each solution. Best estimate of the DL90 of only solution P is within the tested emission rate range. Mean count of points per bin, along with the min and max counts across all bins, is stated in the plot legend.

