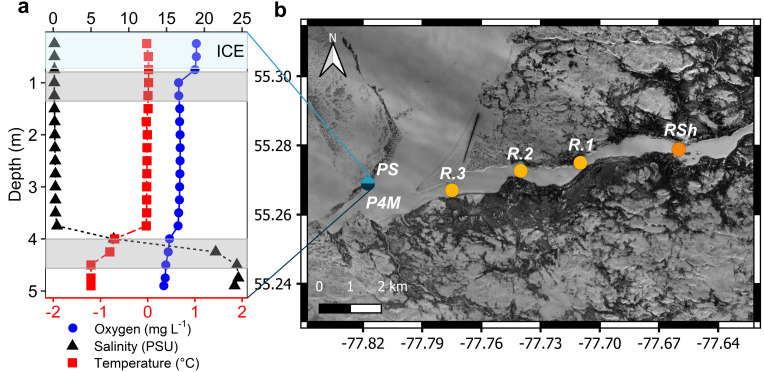
Fig 1.
(a) Vertical profile of temperature (bottom x-axis), oxygen, and salinity (top x-axis for both) in the plume. The upper blue-shaded band corresponds to the ice cover and two gray bands to the depth strata that were sampled for microbial analysis. (b) Map of the sampling sites along the Great Whale River and its plume in Hudson Bay (Copernicus Sentinel-2 data 2019, processed by ESA).

