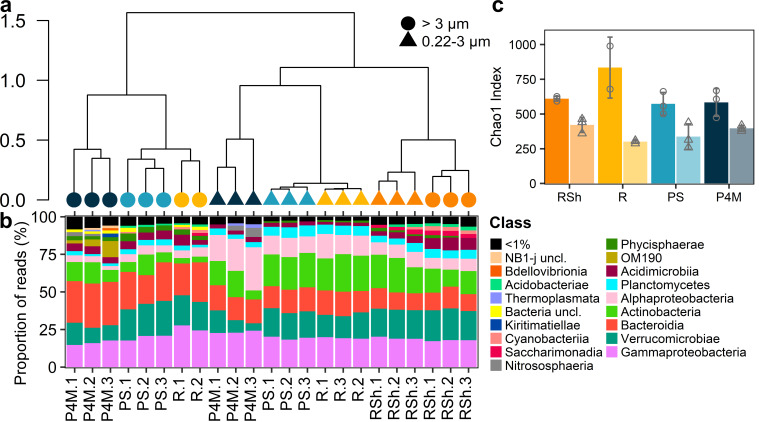
Fig 3.
Prokaryotic communities in the Great Whale River and Plume. (a) Ward hierarchical clustering of the prokaryote community at the ASV level. Shapes correspond to the size fraction and colors to the sampling group (as identified in panel c). Sample identification corresponds to panel b. (b) Stacked bar graph of the read proportions of prokaryote ASVs at class level. Samples are ordered according to the hierarchical clustering in panel a. (c) Bar graphs showing the mean Chao1 index of prokaryotes for each sampling group and separated by size fraction (darker colors and circles correspond to large size fraction; lighter colors and triangles correspond to small size fraction). Shapes correspond to individual values, and error bars are SD. n = 3 except for R large size fraction (n = 2). Site labels are as in Table 1 and Fig. 2 legends. Sample R.3 (>3 µm) is missing as the PCR amplification was unsuccessful.

