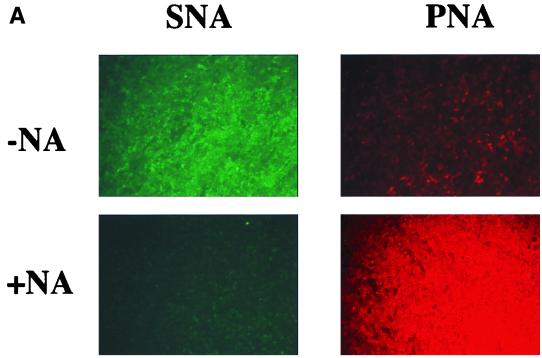
FIG. 5.
Effects of NA treatment on MDCK cell lines. (A) Removal of terminal sialic acid residues. The apical surfaces of MDCK-hCARgpi cells were probed with fluorescein-conjugated SNA lectin (green fluorescence) and rhodamine-conjugated PNA lectin (red fluorescence) in cultures without (−NA) and with (+NA) prior exposure to NA. Similar distribution patterns for SNA and PNA before and after NA treatment were observed for all four transfected MDCK cell lines. Magnification, ×5. (B) Transepithelial resistance measurement before and after NA treatment of the apical surfaces of the respective cell lines. The open bars represent the resistances of the respective cultures before exposure to serum-free medium alone or NA (n = 36); the hatched bars represent the resistances of the respective cultures after exposure to serum-free medium alone (n = 18); and the solid bars represent the resistances of respective cultures after exposure to NA (n = 18).


