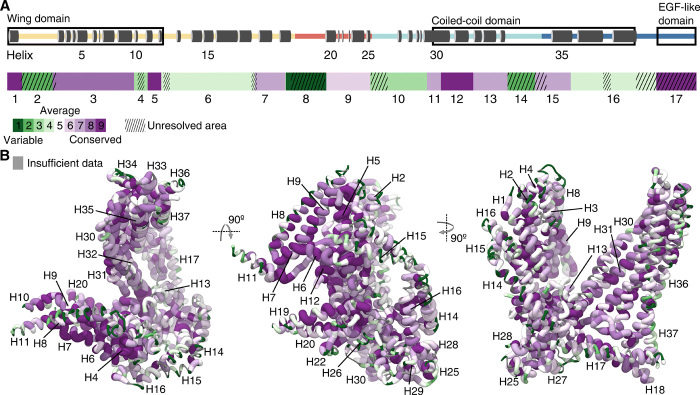
Fig. 4. Sequence variability of MSP-1.
(A) Graphical representation of the primary structure of MSP-1, indicating the resolved helices (top), and division of the sequence in 17 blocks based on sequence variability of the P. falciparum MSP-1 as determined by Tanabe et al. (32) (bottom). Hatching indicates regions that were not resolved in the EM maps. Green blocks correspond to high sequence variability, and purple blocks correspond to high sequence conservation. (B) MSP-1 sequence conservation is mapped onto the main conformation derived for MSP-1 using all 46 Plasmodium MSP-1 genes from various species available from PlasmoDB (63). Green thin tubes indicate high sequence variability, and thick purple tubes indicate high sequence conservation. Areas for which there are insufficient homologous sequence data are colored gray.

