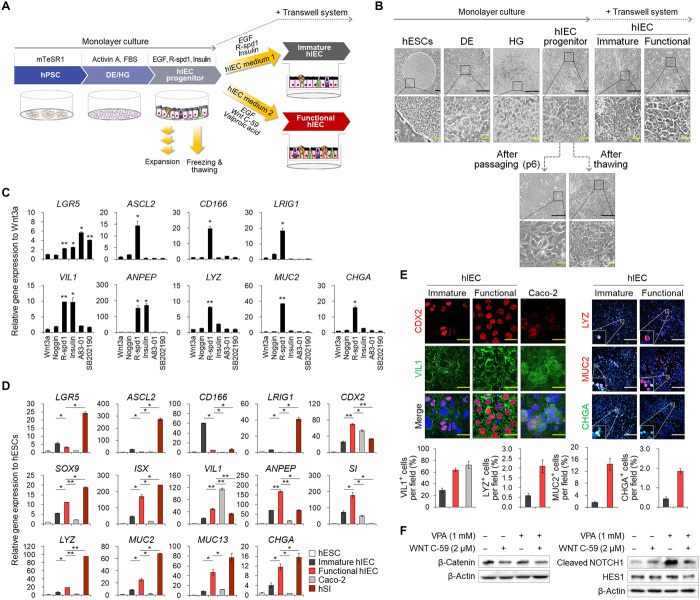
Fig. 1. Differentiation of hESCs into hIEC progenitors and functional hIECs.
(A) Schematic representation of the developed protocol. (B) Morphology of hESCs, DE, HG, hIECs progenitors, immature, functional, passaged, and thawed hIECs. Black scale bars, 200 μm. Yellow scale bars, 50 μm. (C) Relative gene expression of intestinal markers in the compound-treated hIECs. (D) Relative gene expression of intestinal markers in hESC, immature hIECs, functional hIECs, Caco-2 cells, and hSI. (E) Immunofluorescence analysis of the markers of enterocytes (CDX2 and VIL1), Paneth cells (LYZ), goblet cells (MUC2), and enteroendocrine cells (CHGA) in immature and functional hIECs (top). White scale bars, 200 μm. Yellow scale bars, 20 μm. Data represent means ± SEM (n = 4) of each marker positive cell per field (bottom). (F) Western blot analysis to verify expression levels of β-catenin, cleaved NOTCH1, and HES1 during differentiation into immature hIECs and functional hIECs. *P < 0.05 and **P < 0.01 using two-tailed t test.

