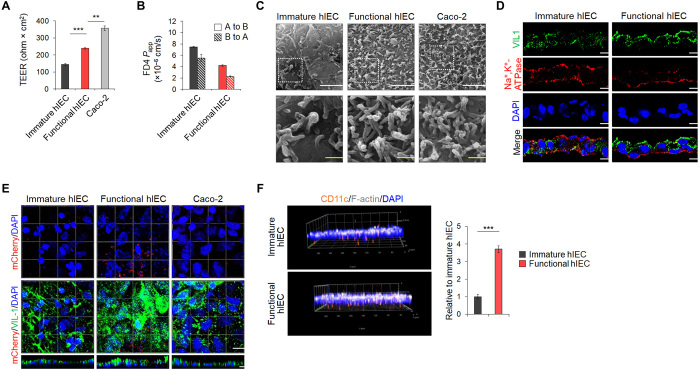
Fig. 2. Functional characterization of hPSC-derived hIEC monolayers.
(A) TEER values of immature hIECs, functional hIEC, and Caco-2 cell monolayers. Data represent means ± SEM (n = 4). (B) The Papp coefficient of FITC-dextran 4 kDa in either the apical to basolateral (A to B) or the basolateral to apical (B to A) direction. Data represent means ± SEM (n = 4). (C) Representative SEM images of apical surface of the immature hIEC, functional hIEC, and Caco-2 cell monolayers. White scale bars, 2 μm. Yellow scale bars, 500 nm. (D) Confocal immunofluorescence analysis showing vertical sections of immature and functional hIECs stained for the markers of apical brush border (VIL1) and basolateral (Na+,K+-ATPase) side. Scale bars, 10 μm. (E) Representative confocal images of L. plantarum–mCherry (red) inoculated immature hIEC, functional hIEC, and Caco-2 cells at 2 hours after inoculation. XZ projection of a 3D confocal micrograph showing adhesion of L. plantarum–mCherry (red) to the apical side of immature hIEC, functional hIEC, and Caco-2 cells stained for the apical brush border (VIL1) marker. Scale bar, 10 μm. (F) Representative 3D confocal Z-stack images of macrophage migration across the immature hIECs or the functional hIECs after liposaccharide (LPS) treatment for 24 hours. F-actin, white; CD11c, orange; DAPI, blue; magnification ×20 (left). Data are means ± SEM (n = 3) of CD11c-positive cell per field (right). **P < 0.01 and ***P < 0.001 using two-tailed t test.

