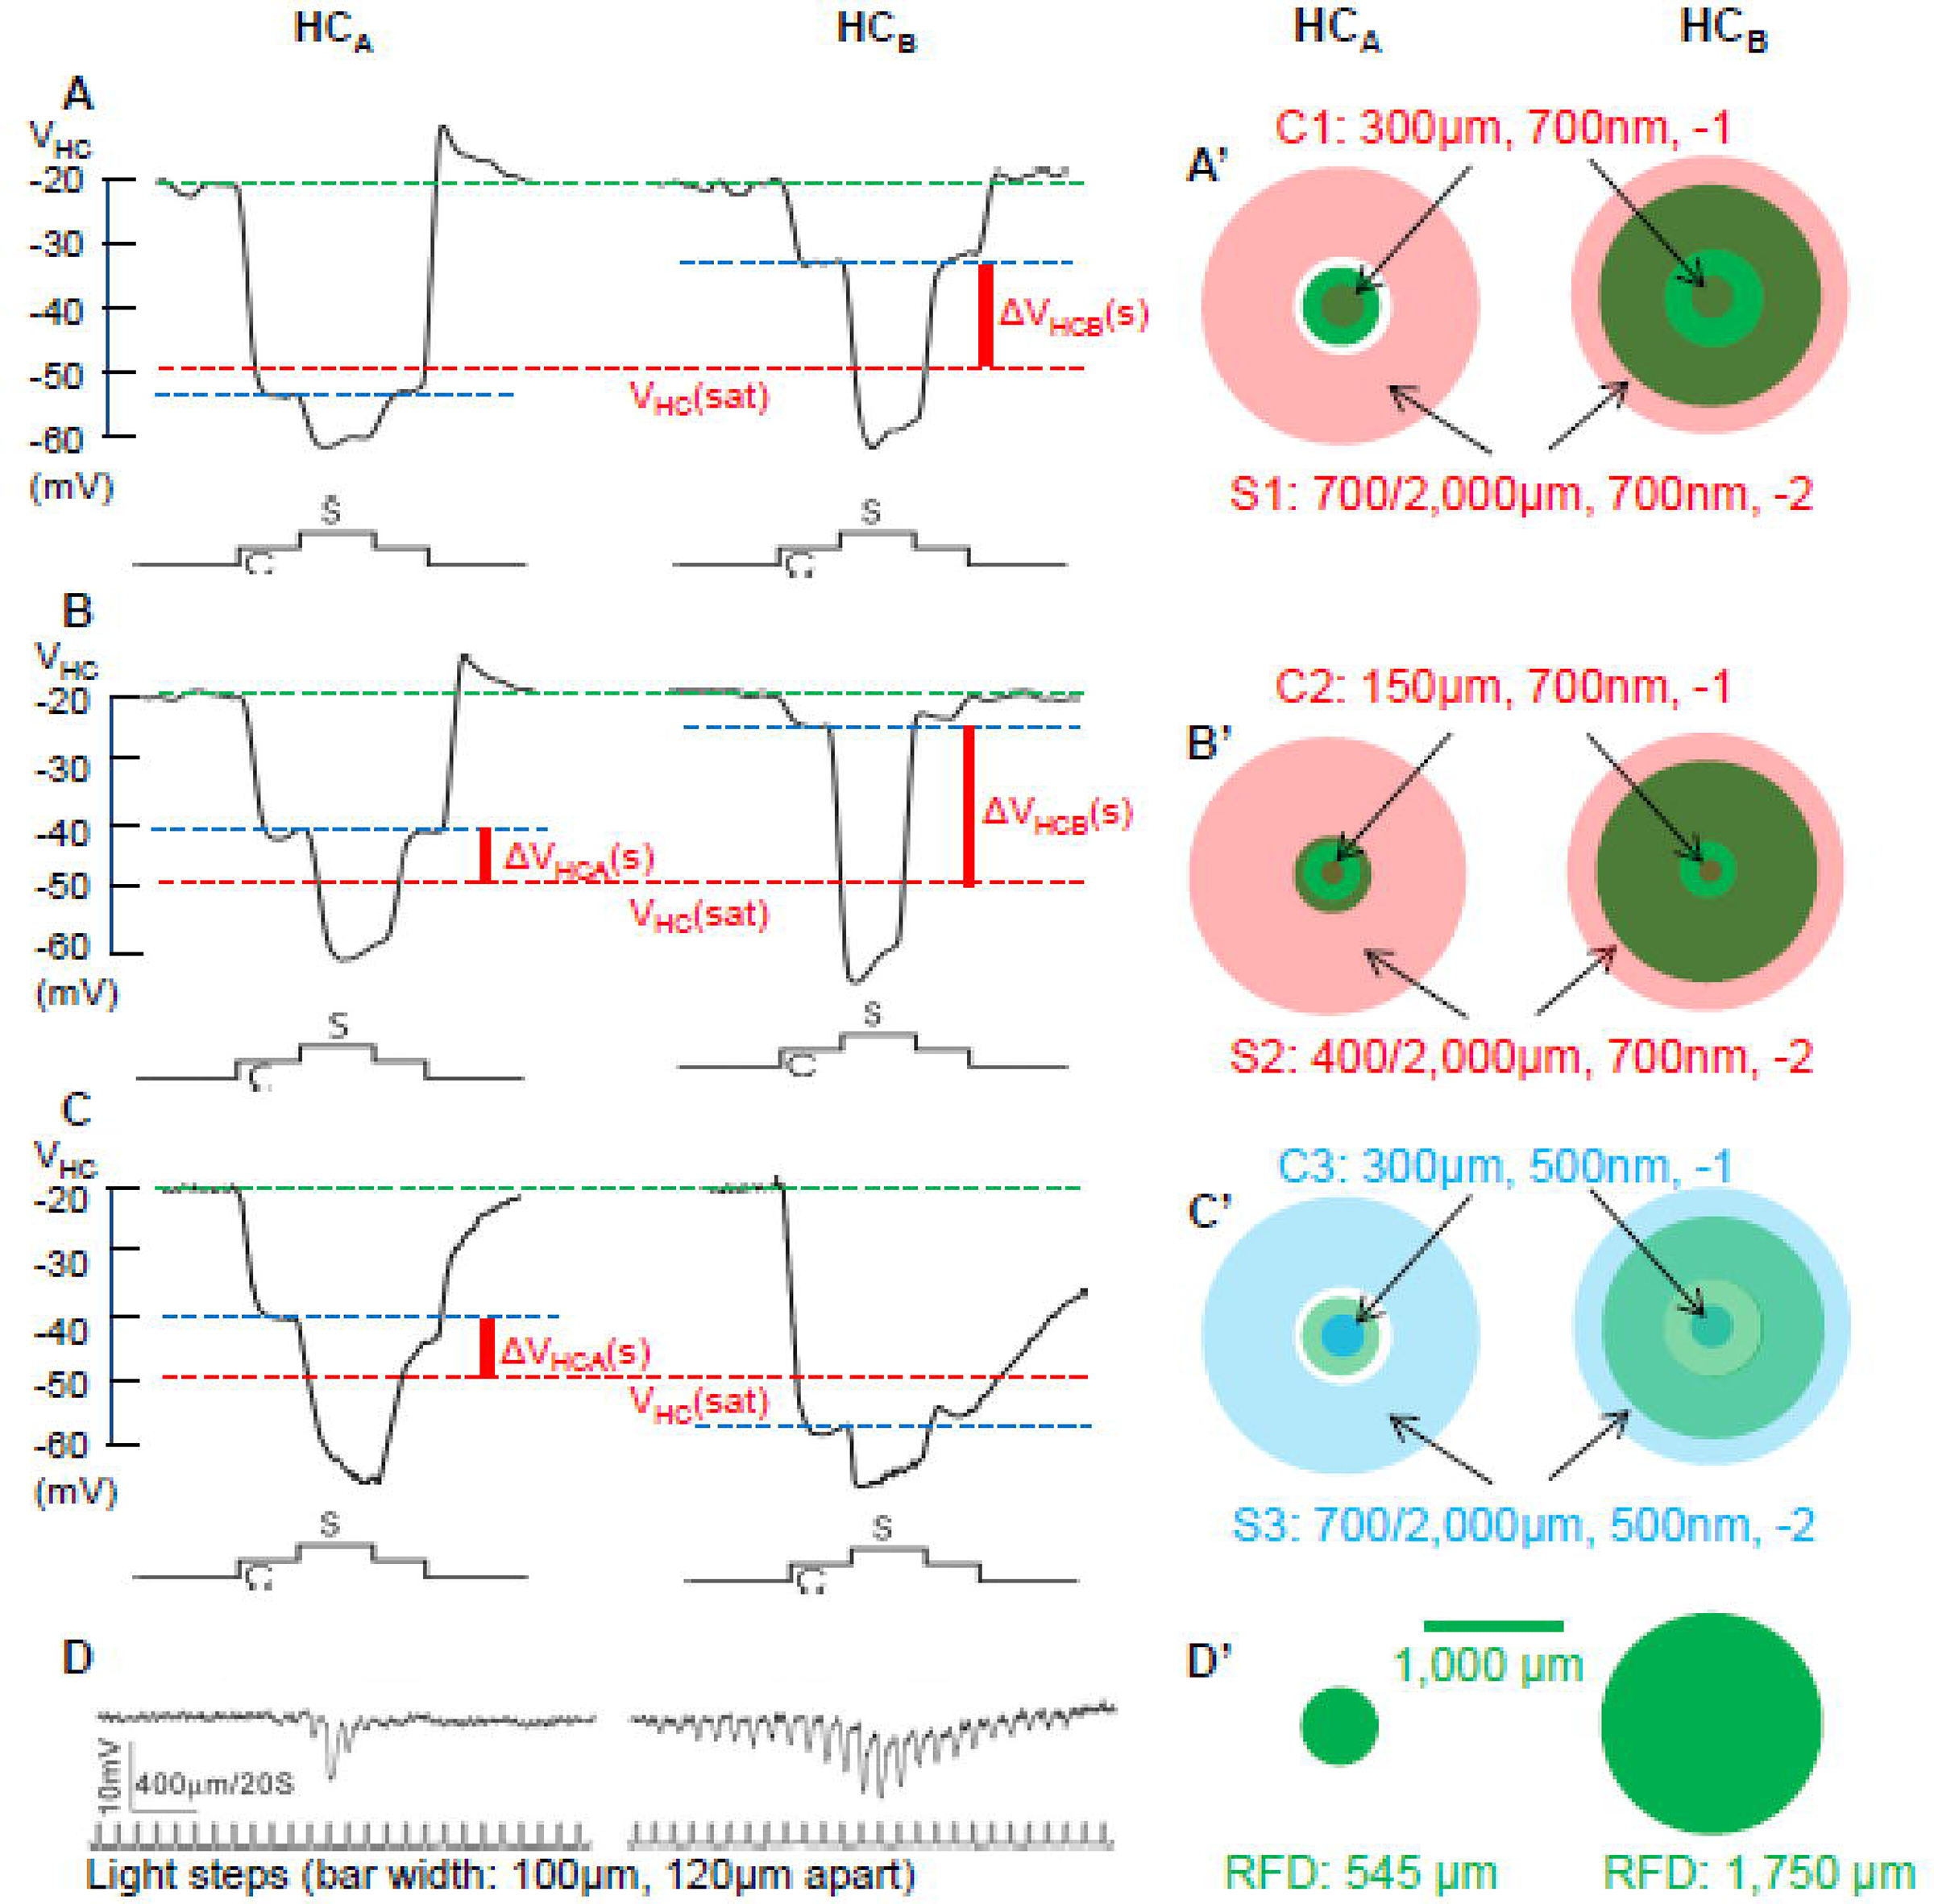
Figure 1.

A-C: Center/surround voltage responses of a HCA and a HCB elicited by stimulus C1S1 (A) and C2S2 (B) and and C3S3 (C). A’ and B’ illustrate dimensions of C1S1 and C2S2 in red, respectively, and C’ illustrate dimensions of C3S3 in blue. Green dashed lines: HC dark membrane potential; blue dashed lines, HC potential in the presence of center light; red dashed lines: saturation voltage of the HC output synapse; ΔVHCA/B(s): surround-elicited HC output voltage signal (voltage between blue and red dashed lines, solid vertical red lines). D: Measurements of the HC receptive fields by recording voltage responses to a 100-µm-wide light bar moving in 120-µm steps, similar to the protocol used in previous reports (Zhang et al., 2006a), the HCA is a narrow field cell (receptive field diameter, RFD≈520 µm, small green disc in D’) and the HCB is a wide field cell (RFD≈1,500 µm, large green disc in D’).
