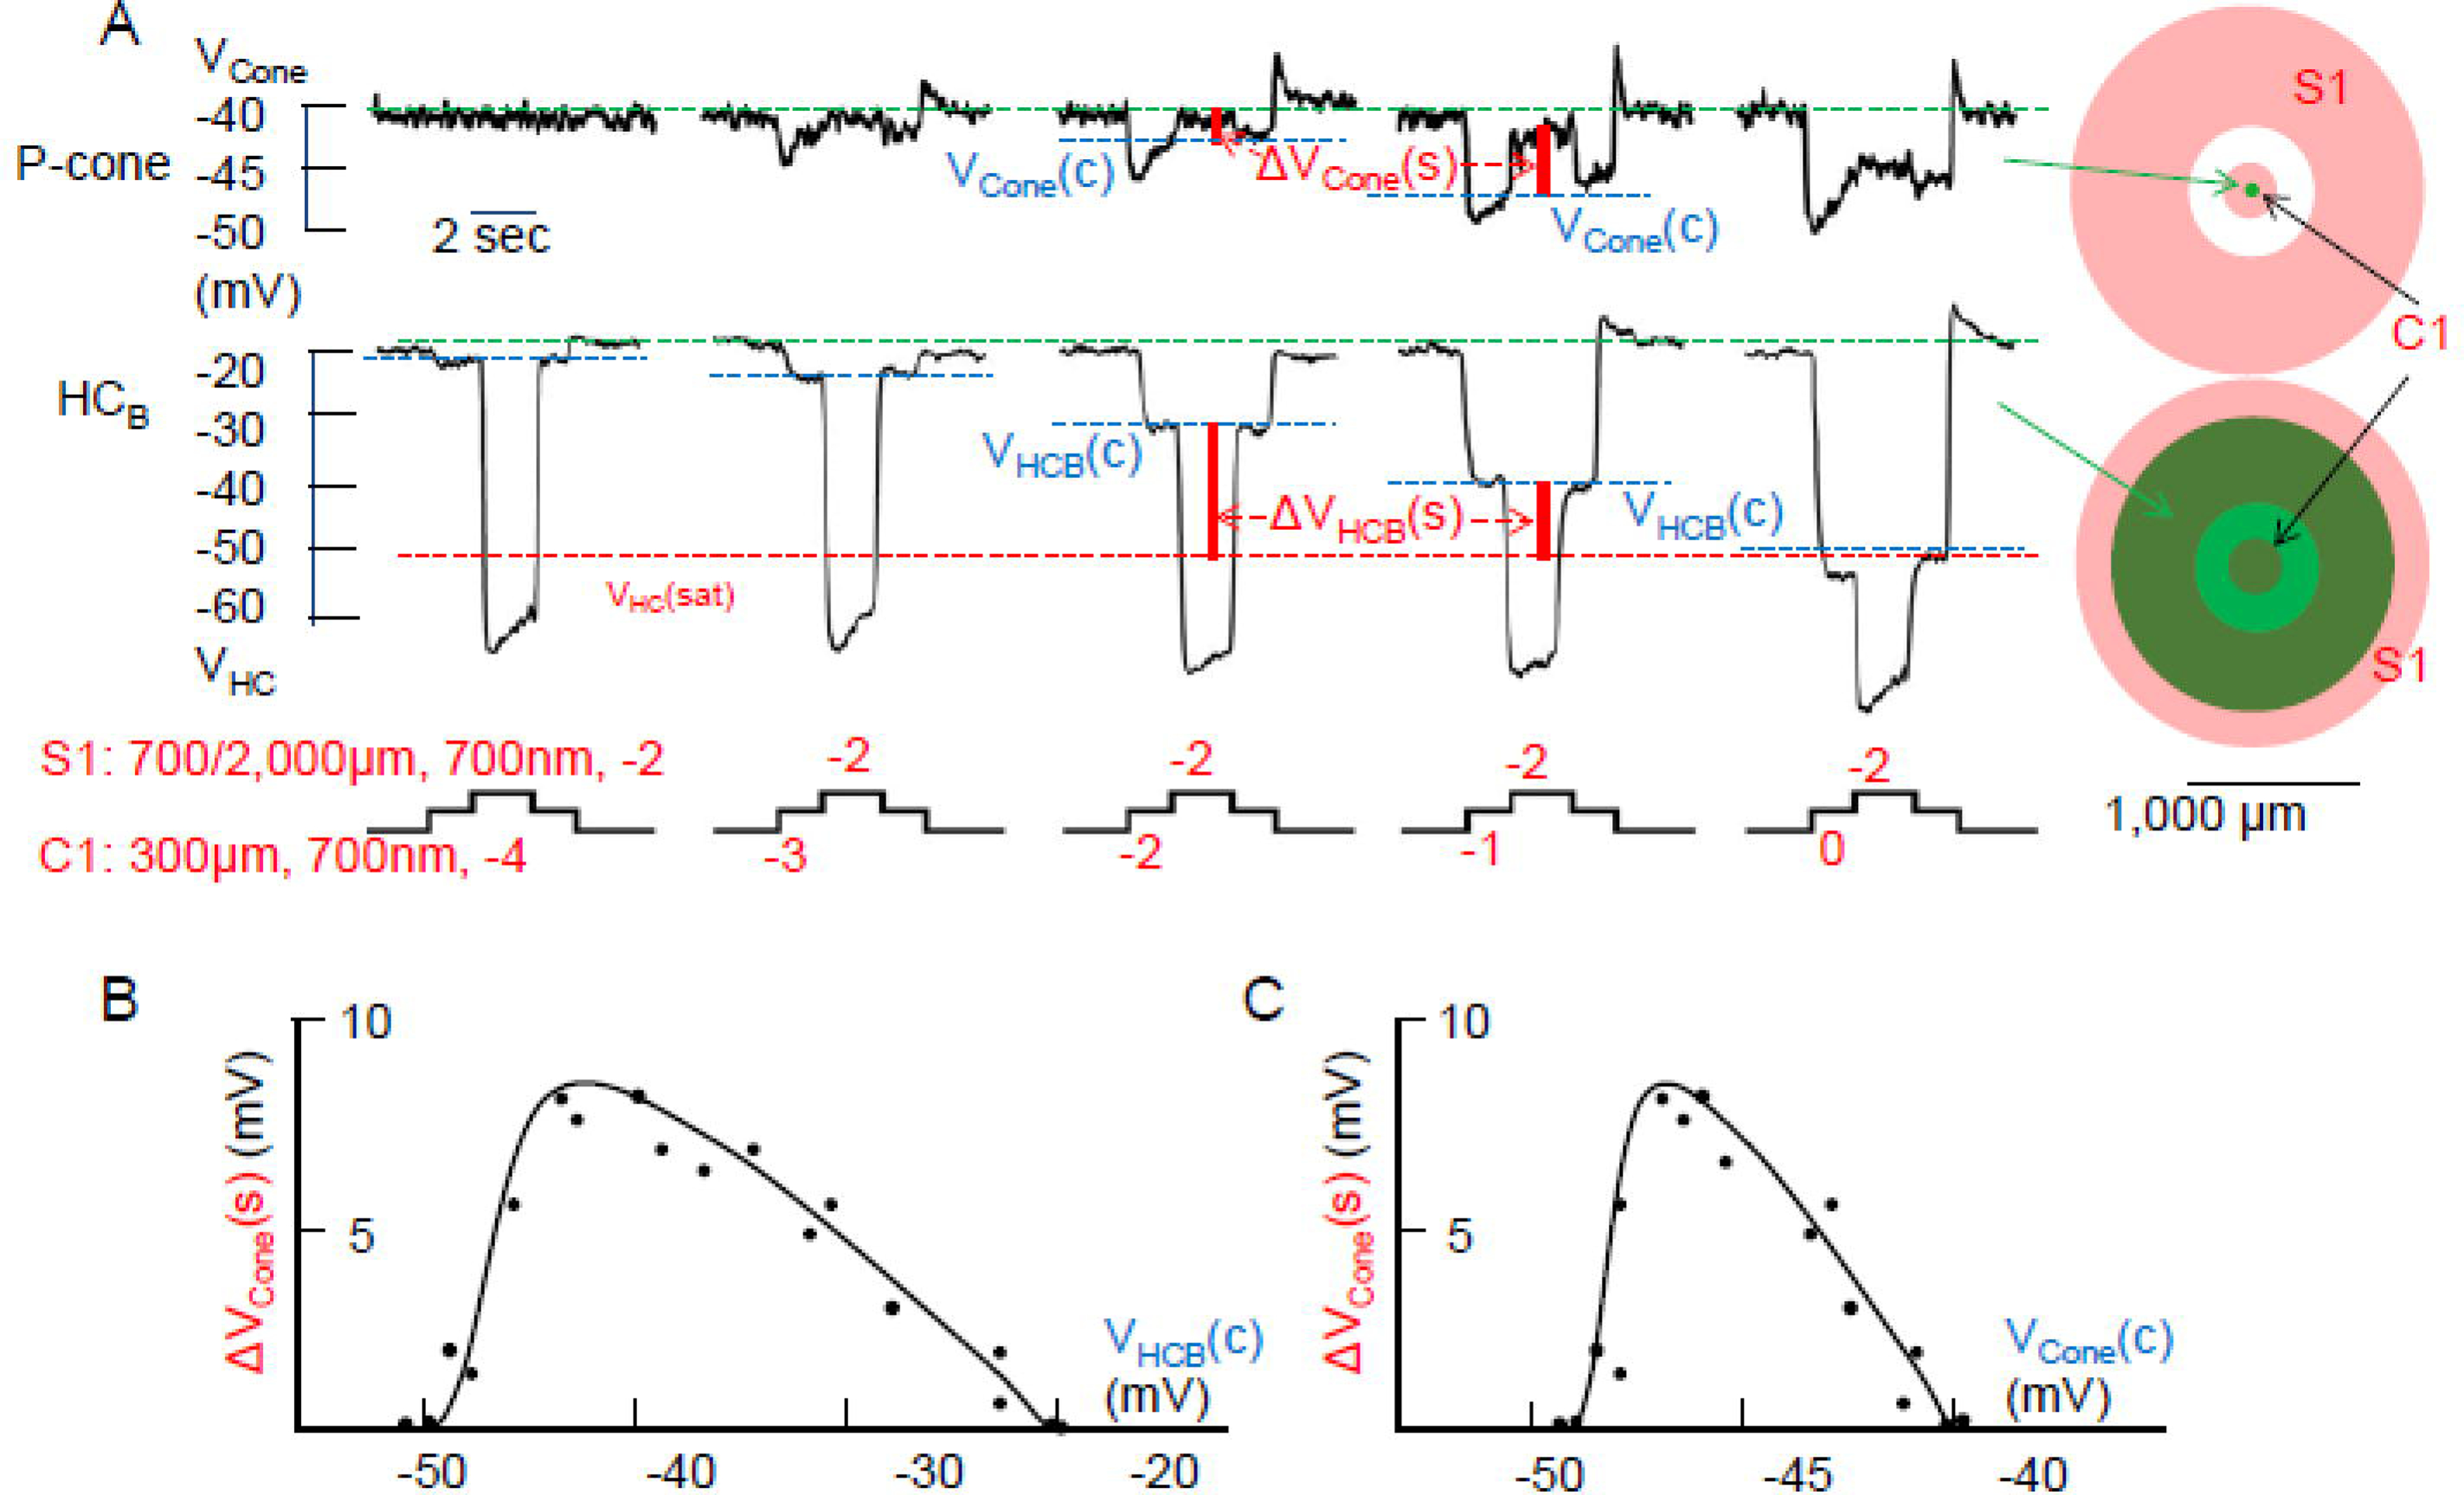
Figure 3.

A: Voltage responses of a P-cone and a HCB to stimulus C1S1 of increasing center light intensity (C1 varied from −4 to 0 log unit attenuation) while the surround light intensity remains the same (S1: −2). Green dashed lines: cone or HC dark membrane potential; blue dashed lines, cone or HC potential in the presence of center light; red dashed lines: saturation voltage of the HC output synapse; ΔVCone(s): surround-elicited depolarizing response in the cone (voltage between two blue dashed lines). ΔVHCB(s): surround-elicited HC output voltage signal (voltage between blue and red dashed lines). B: Plot of cone surround responses (ΔVCone(s)) vs HC voltage in the presence of center light (VHCB(c)). C: Plot of ΔVCone(s)) vs cone voltage in the presence of center light (VCone(c)). Data points in the two plots were obtained from 4 pairs of P-cone/HCBs, and both plots are skewed bell-shaped with a peak near VHCB(c) =−43 mV and near VCone(c)= −47 mV.
