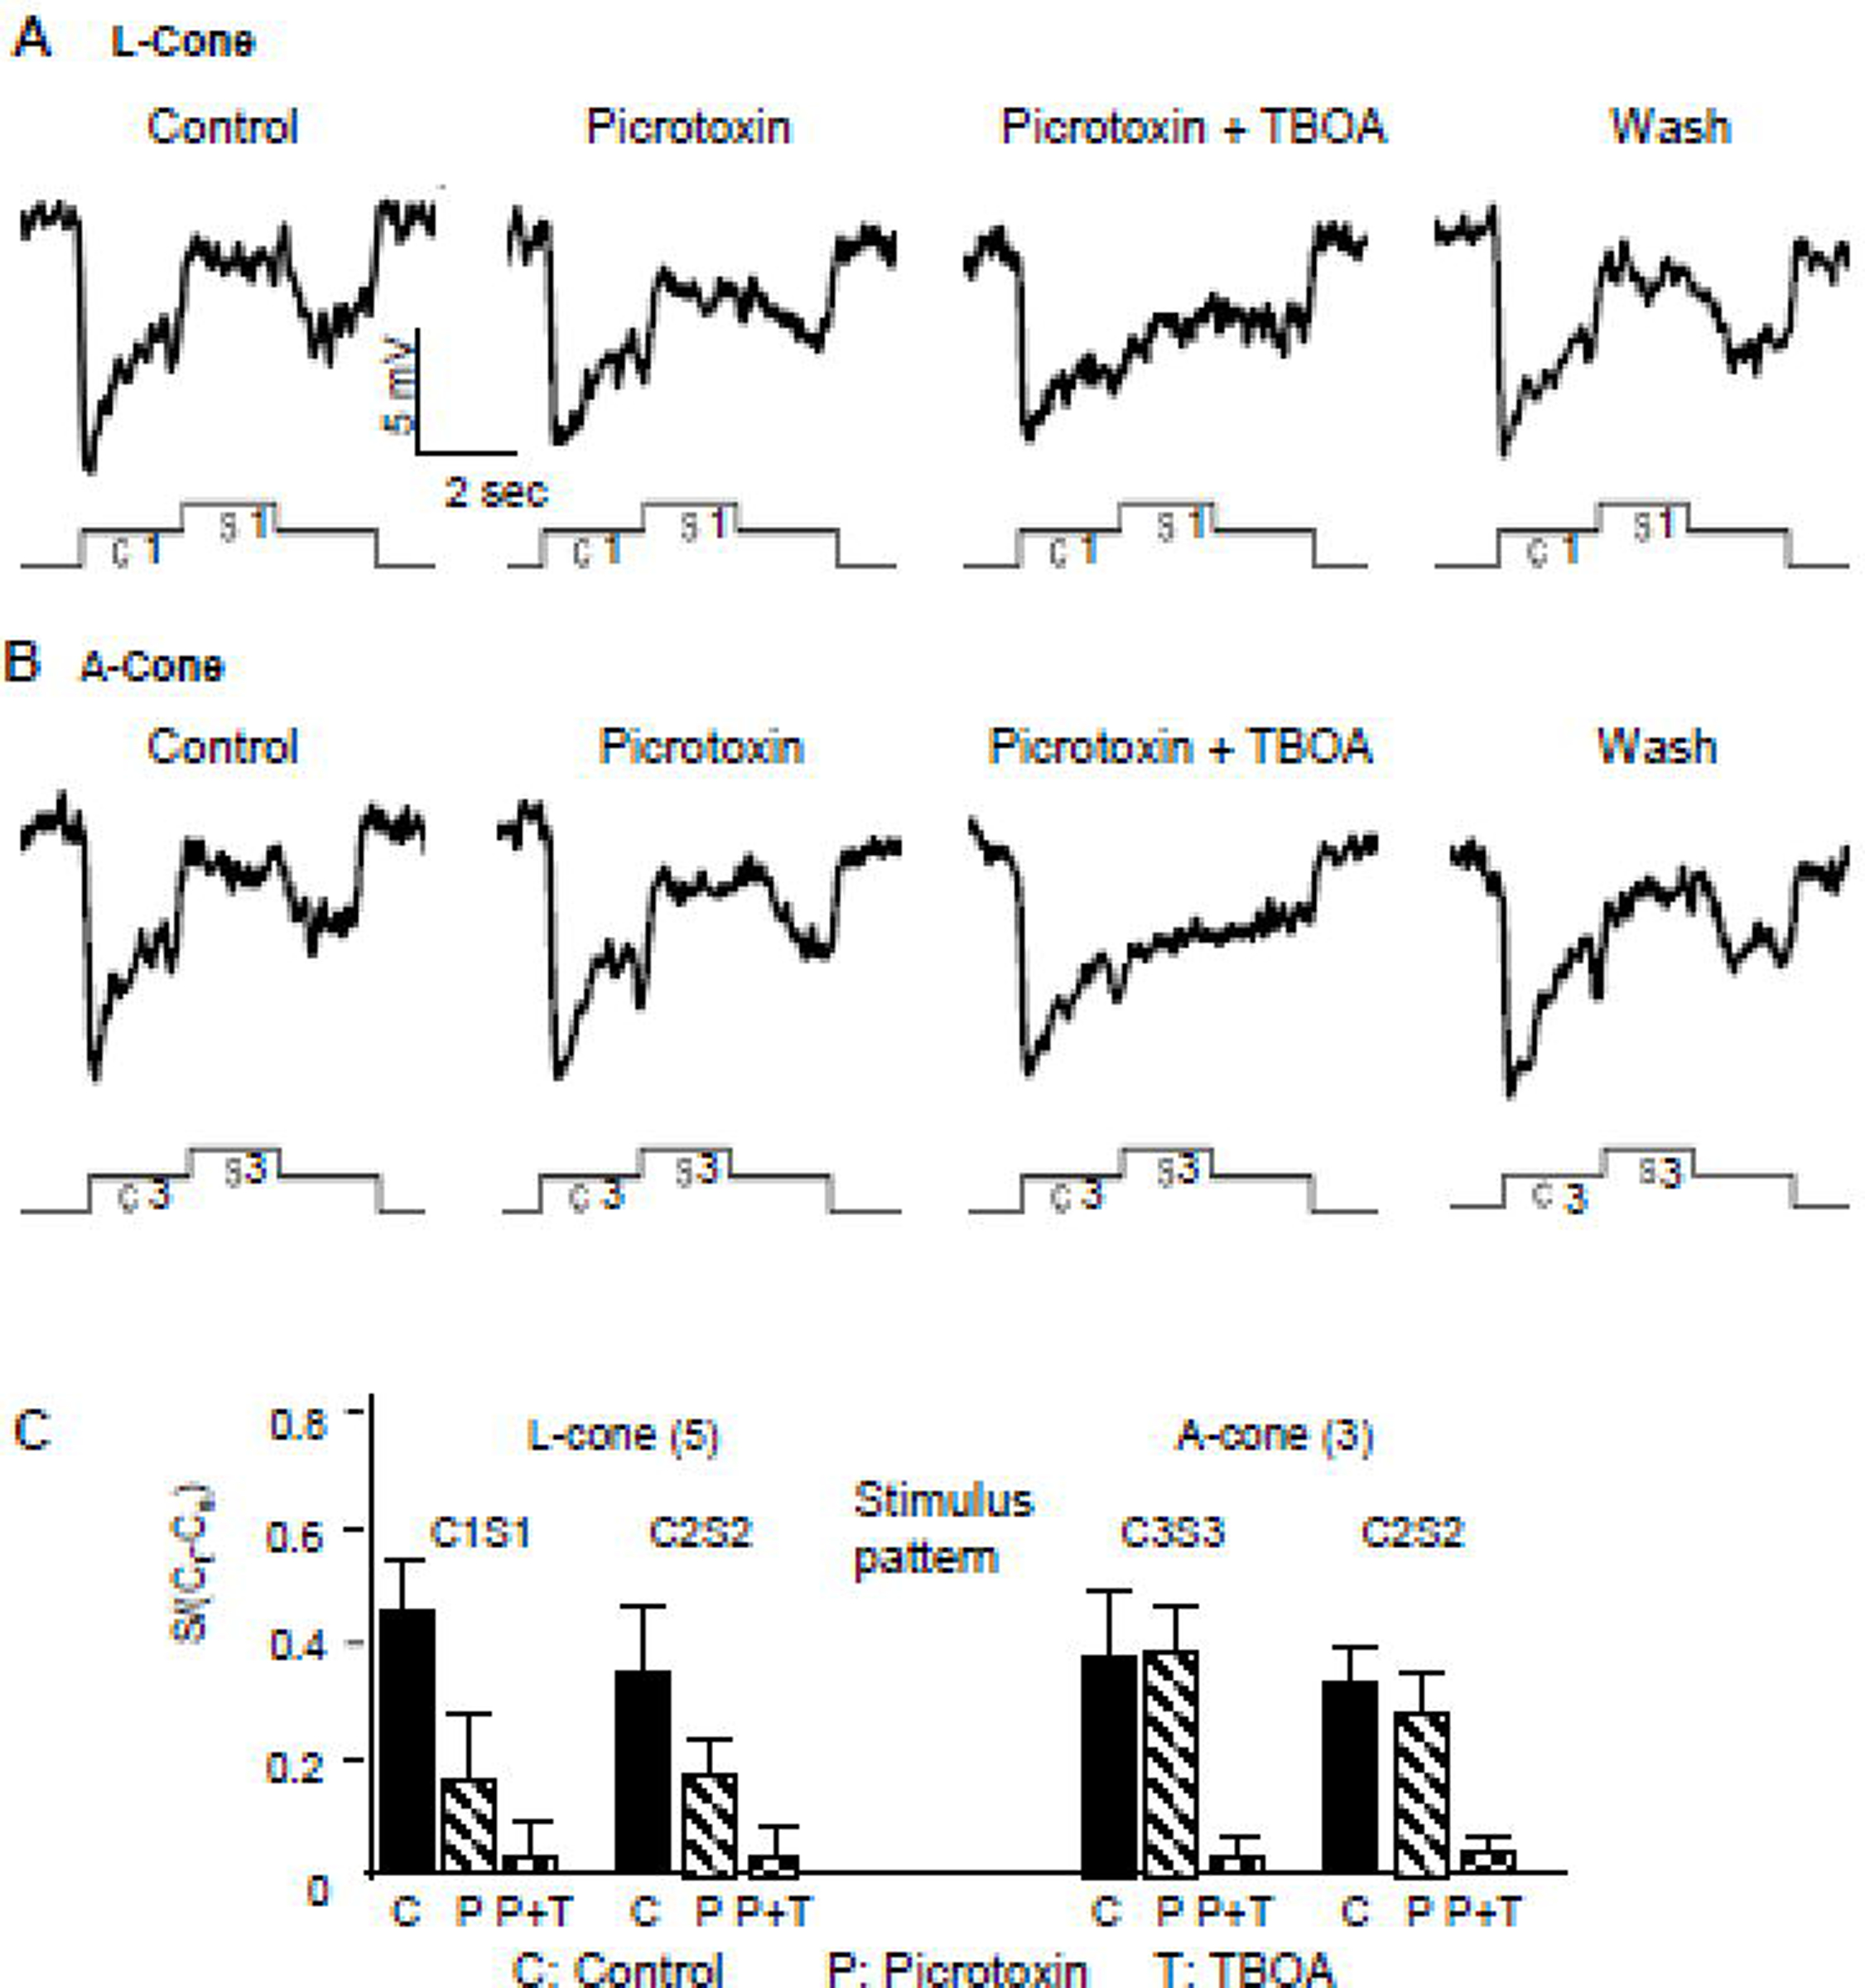
Figure 6.

Voltage responses of a L-cone to stimulus C1S1 (contains feedback signals from B-type HCs) (A) and an A-cone elicited by C3S3 (contains feedback signals from A-type HCs) (B) in normal saline (control), during PTX application, during PTX+TBOA application and after drug washout (wash). The average surround responses of L-cones and A-cones elicited by stimuli C1S1, C2S2 and C3S3 in control (C), in PTX (P) and in PTX and TBOA (P+T) are given in C.
