
Figure 1: TXNRD1 localizes into CCFs and is required for cGAS-STING activation during senescence.
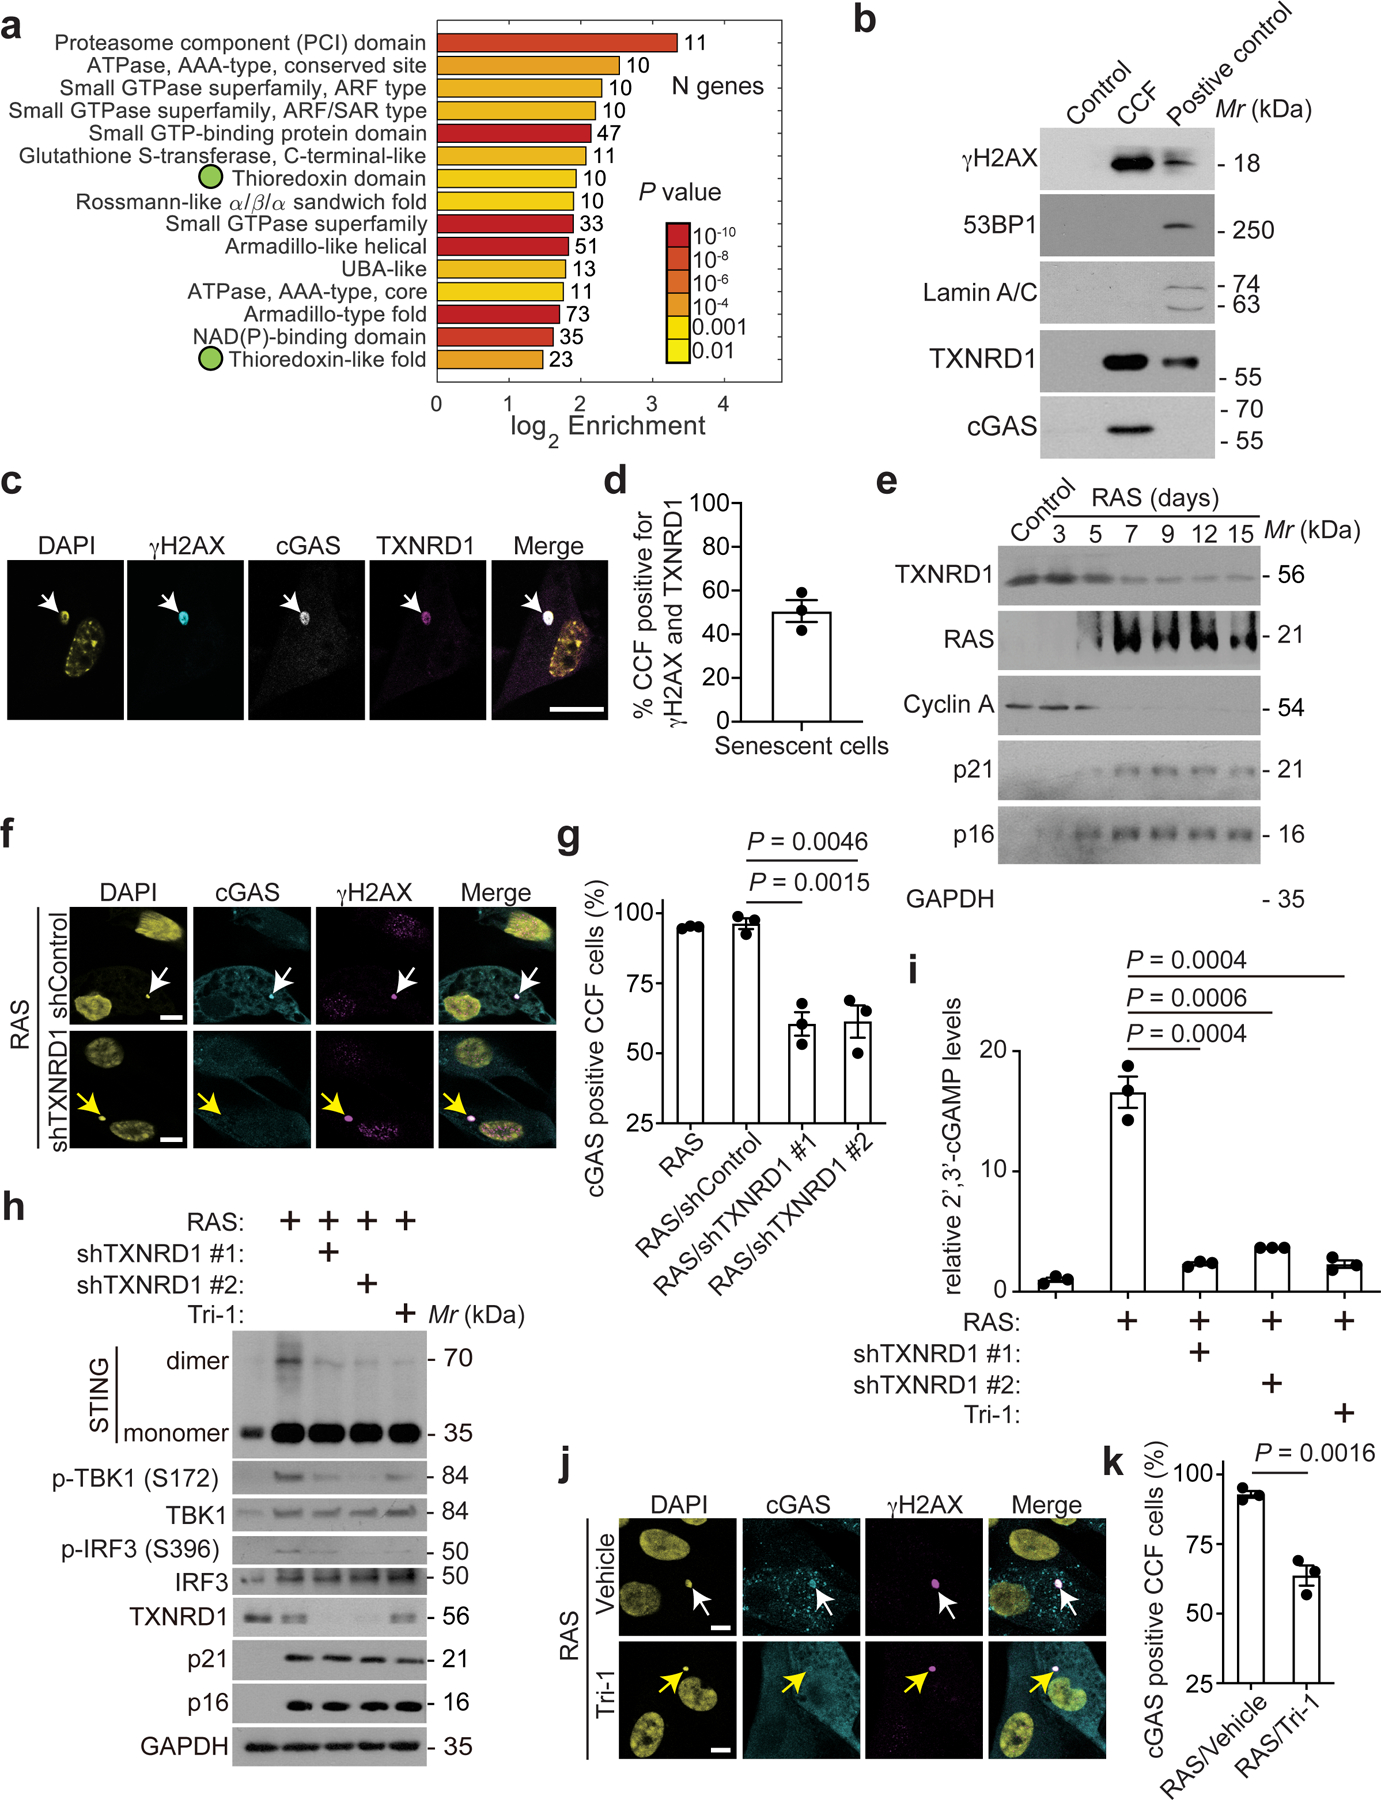
a, The top 15 domains enriched by CCFs proteins isolated from oncogenic RAS-induced senescent IMR90 cells. Two green dots indicate thioredoxin-related domains.
b, Immunoblot of the indicated proteins in CCFs isolated from oncogenic RAS-induced IMR90 cells. Proliferating cells having gone through the same purification procedure was used as a negative control. Whole cell lysate from etoposide induced senescent IMR90 cells was used as a positive control.
c,d, Immunostaining of the indicated proteins in oncogenic RAS-induced senescent IMR90 cells (c). The arrow indicates an example of γH2AX, cGAS and TXNRD1 co-localized CCFs. CCFs that are positive for γH2AX and also positive for TXNRD1 were quantified (d). Scale bar = 10 μm.
e, Immunoblot of the indicated proteins in control proliferating and oncogenic RAS-induced senescent cells IMR90 cells harvested at the indicated time points.
f,g, Immunostaining for cGAS and γH2AX in oncogenic RAS-induced senescent IMR90 cells with or without TXNRD1 knockdown (f). White arrow indicates an example of cGAS and γH2AX positive CCFs in control cells, while the yellow arrow indicates an example of cGAS negative, γH2AX positive CCFs in TXNRD1 knockdown cells. γH2AX-positive CCFs that are positive for cGAS from the indicated groups were quantified (g). Scale bar = 10 μm.
h,i, Immunoblot of the indicated protein in control proliferating and oncogenic RAS-induced senescent IMR90 cells with or without TXNRD1 knockdown or treatment with a pharmacological TXNRD1 inhibitor Tri-1 (5 μM) (h). In addition, cellular 2’ 3’-cGAMP levels were measured in the indicated cells (i).
j,k, Immunostaining for cGAS and γH2AX in oncogenic RAS-induced senescent IMR90 cells treated with vehicle control or TXNRD1 inhibitor Tri-1 (5 μM) (j). White arrow indicates an example of cGAS and γH2AX positive CCFs in control cells, while the yellow arrow indicates an example of cGAS negative, γH2AX positive CCFs in Tri-1 treated cells. γH2AX-positive CCFs that are positive for cGAS from the indicated groups were quantified (k). Scale bar = 10 μm.
Data represent mean ± s.e.m. n = 3 biologically independent experiments unless otherwise stated. P-values were calculated using a two-tailed t test.