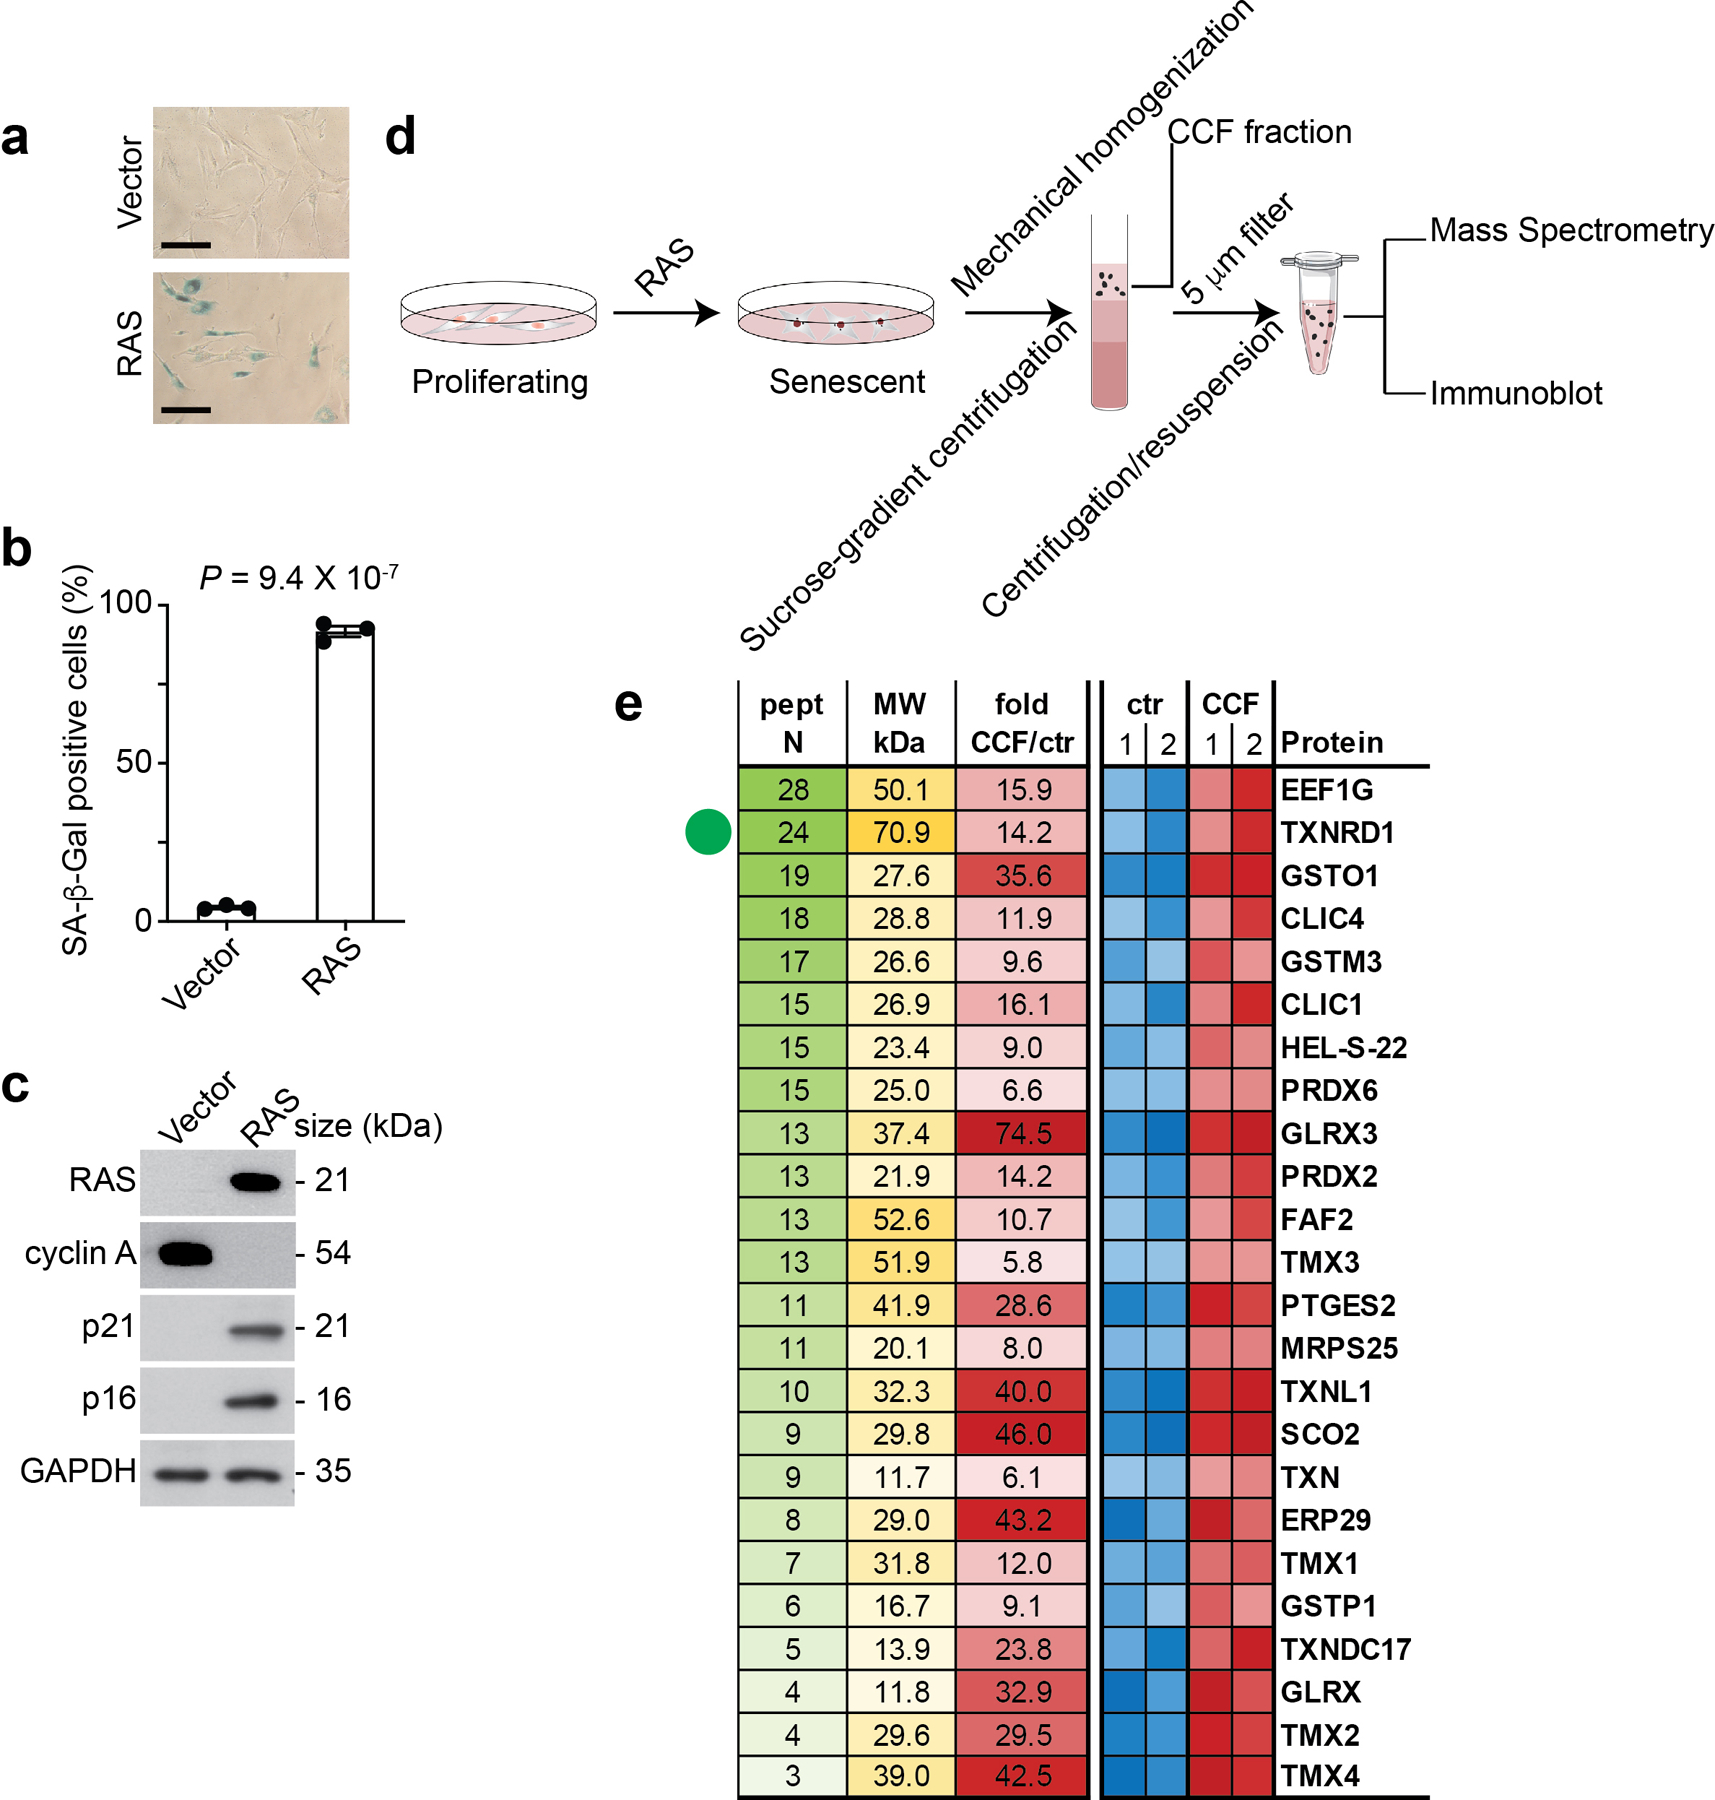
Extended Data Figure 1: Purification of CCFs from oncogene-induced senescent cells.

a-c, IMR90 cells were induced into senesce by oncogenic H-RASG12V and were subjected to SA-β-gal staining (a). SA-β-gal positive cells were quantified in the indicated groups (b). Expression of the indicated proteins in the indicated control senescent cells was analyzed by immunoblot (c). Scale bar = 100 μm.
d, Schematics of the protocol used for purification of CCFs.
e, Intensity heatmap of the thioredoxin-related proteins enriched in CCFs. Sorted by number of the detected peptides with two independent biological repeats.
Data represent mean ± s.e.m. n = 3 biologically independent experiments unless otherwise stated. P-values were calculated using a two-tailed t test.
