Figure 19:
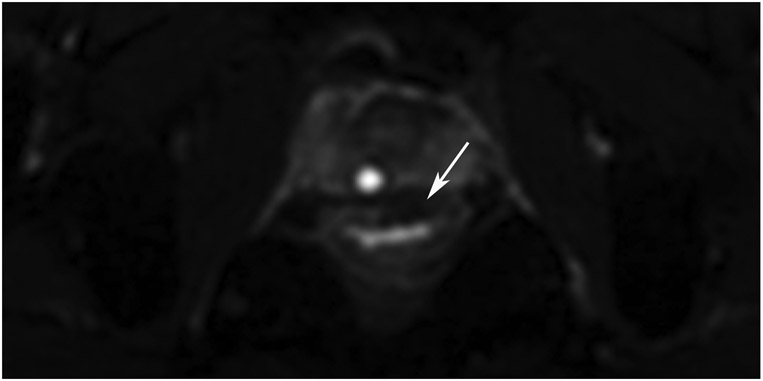
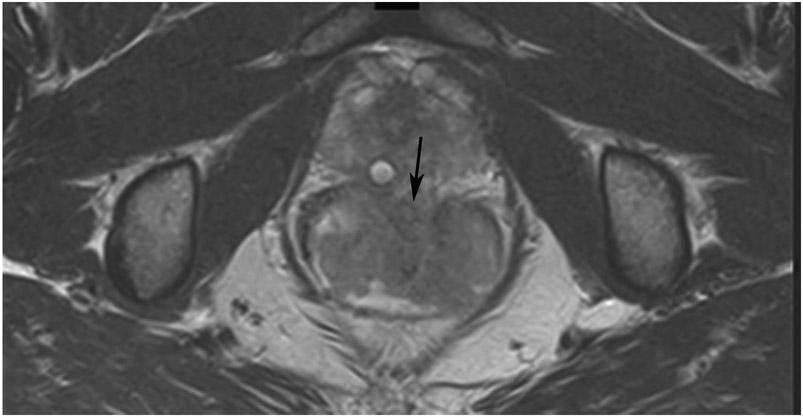
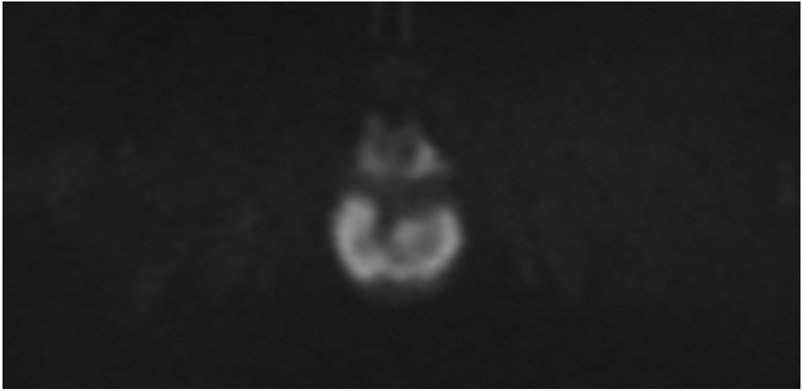
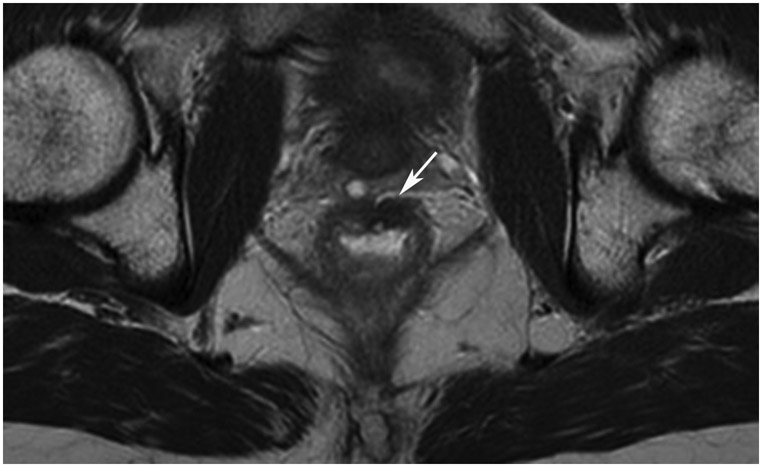
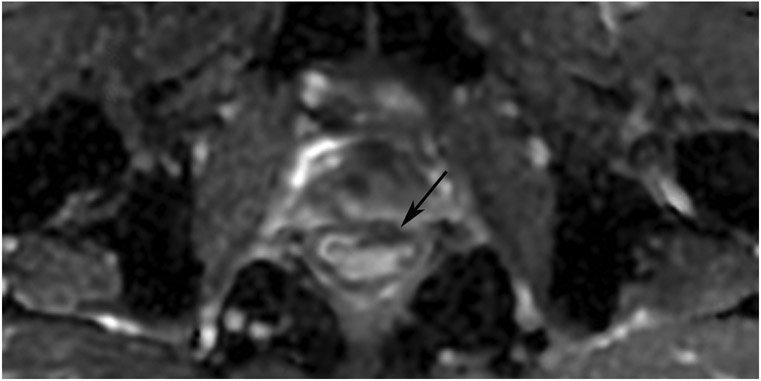
38-year-old man with primary rectal cancer underwent staging and follow-up MRI. (a) External facility 3-mm axial T2WI slice shows a polypoid tumor with anterior attachment (arrow). (b) Matching 6-mm b800 axial DWI slice reveals restriction. (c) Post-TNT surveillance axial T2WI shows a dense fibrotic scar at the attachment point of the prior tumor (arrow). (d) Matching b1500 DWI slice reveals a dark signal (arrow). (e) Matching ADC map also shows a dark signal (arrow). This is irrelevant. The ADC map is used to confirm if the bright signal on DWI is restriction or a T2 effect. The ADC map need not be consulted if there is no bright signal on DWI in tumor bed as in this case. Looking at ADC and seeing dark is only relevant if DWI is bright. This distinctive dark-dark pattern is called “T2 dark-through.”
TEACHING POINT: The ADC map is used to exclude T2 effects accounting for bright signal on DWI (a heavy T2WI sequence with fat saturation and additional motion-probing gradients). If there is no bright signal on DWI, there is no need to check the ADC map. In this case, the ADC map shows dark signal due to dense fibrotic scar. The pairing of DWI bright and ADC dark is the only pairing indicating restricted signal. The combination of DWI dark and ADC dark is known as “T2 dark-through.”

