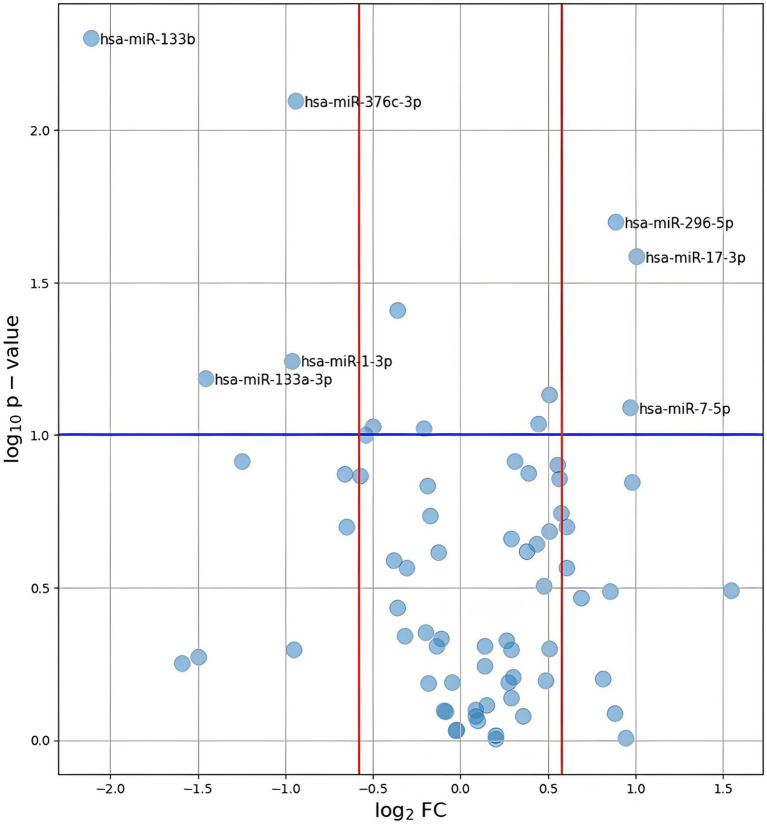
Figure 2.
Plot of log2(FC) against –log10(p-value) for all analyzed miRNAs. The values presented on the plot were calculated using the p-values obtained after performing Permutation Yuen-Welch t test. A blue line represents the level of p-value = 0.1. Red lines indicate the range of FC < 0, 67 or > 1, 5.

