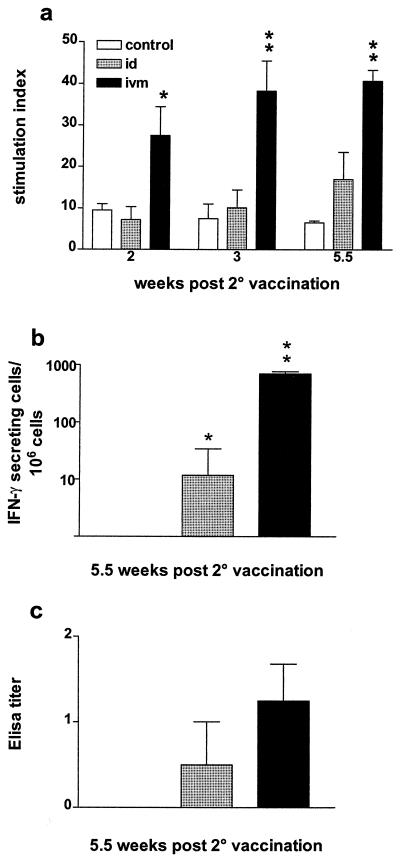
FIG. 1.
Immune responses after DNA immunization of cattle with a plasmid encoding BHV-1 gB. (a) Antigen-specific proliferation of PBMC at various time points after vaccination. Each value is the average ± the standard error of the mean of the SI. (b) Difference between the number of spots per 106 cells in antigen-stimulated wells and the number of spots per 106 cells in nonstimulated wells (expressed as geometric means). (c) Serum ELISA titers 5.5 weeks after the second immunization (10 days before challenge). ELISA titers are expressed as the reciprocal of the highest dilution resulting in a reading of 2 standard deviations above the control value. The values displayed are geometric means for each group. Control, not immunized. ∗, P < 0.05; ∗∗, P < 0.01 (significance of differences from the control group).

