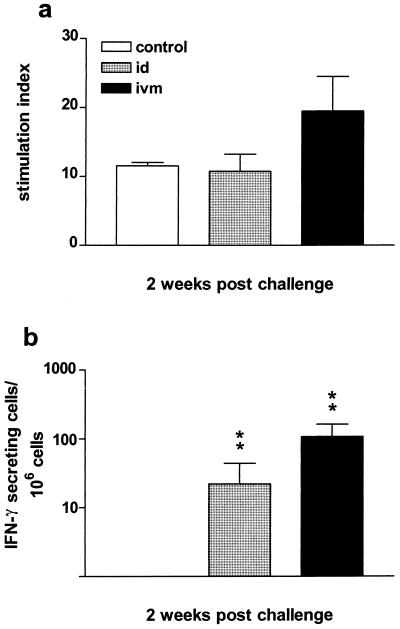
FIG. 3.
Cellular immune responses after BHV-1 challenge. (a) Antigen-specific proliferation of PBMC after challenge. (b) Number of spots per 106 cells in antigen-stimulated wells minus the number of spots per 106 cells in nonstimulated wells. The differences between the i.v.m. and i.d. groups and the control group are highly significant (P < 0.01). The values are the averages ± the standard error of the mean of the SIs in panel a and geometric means in panel b. Control, not immunized; ∗∗, P < 0.01.

