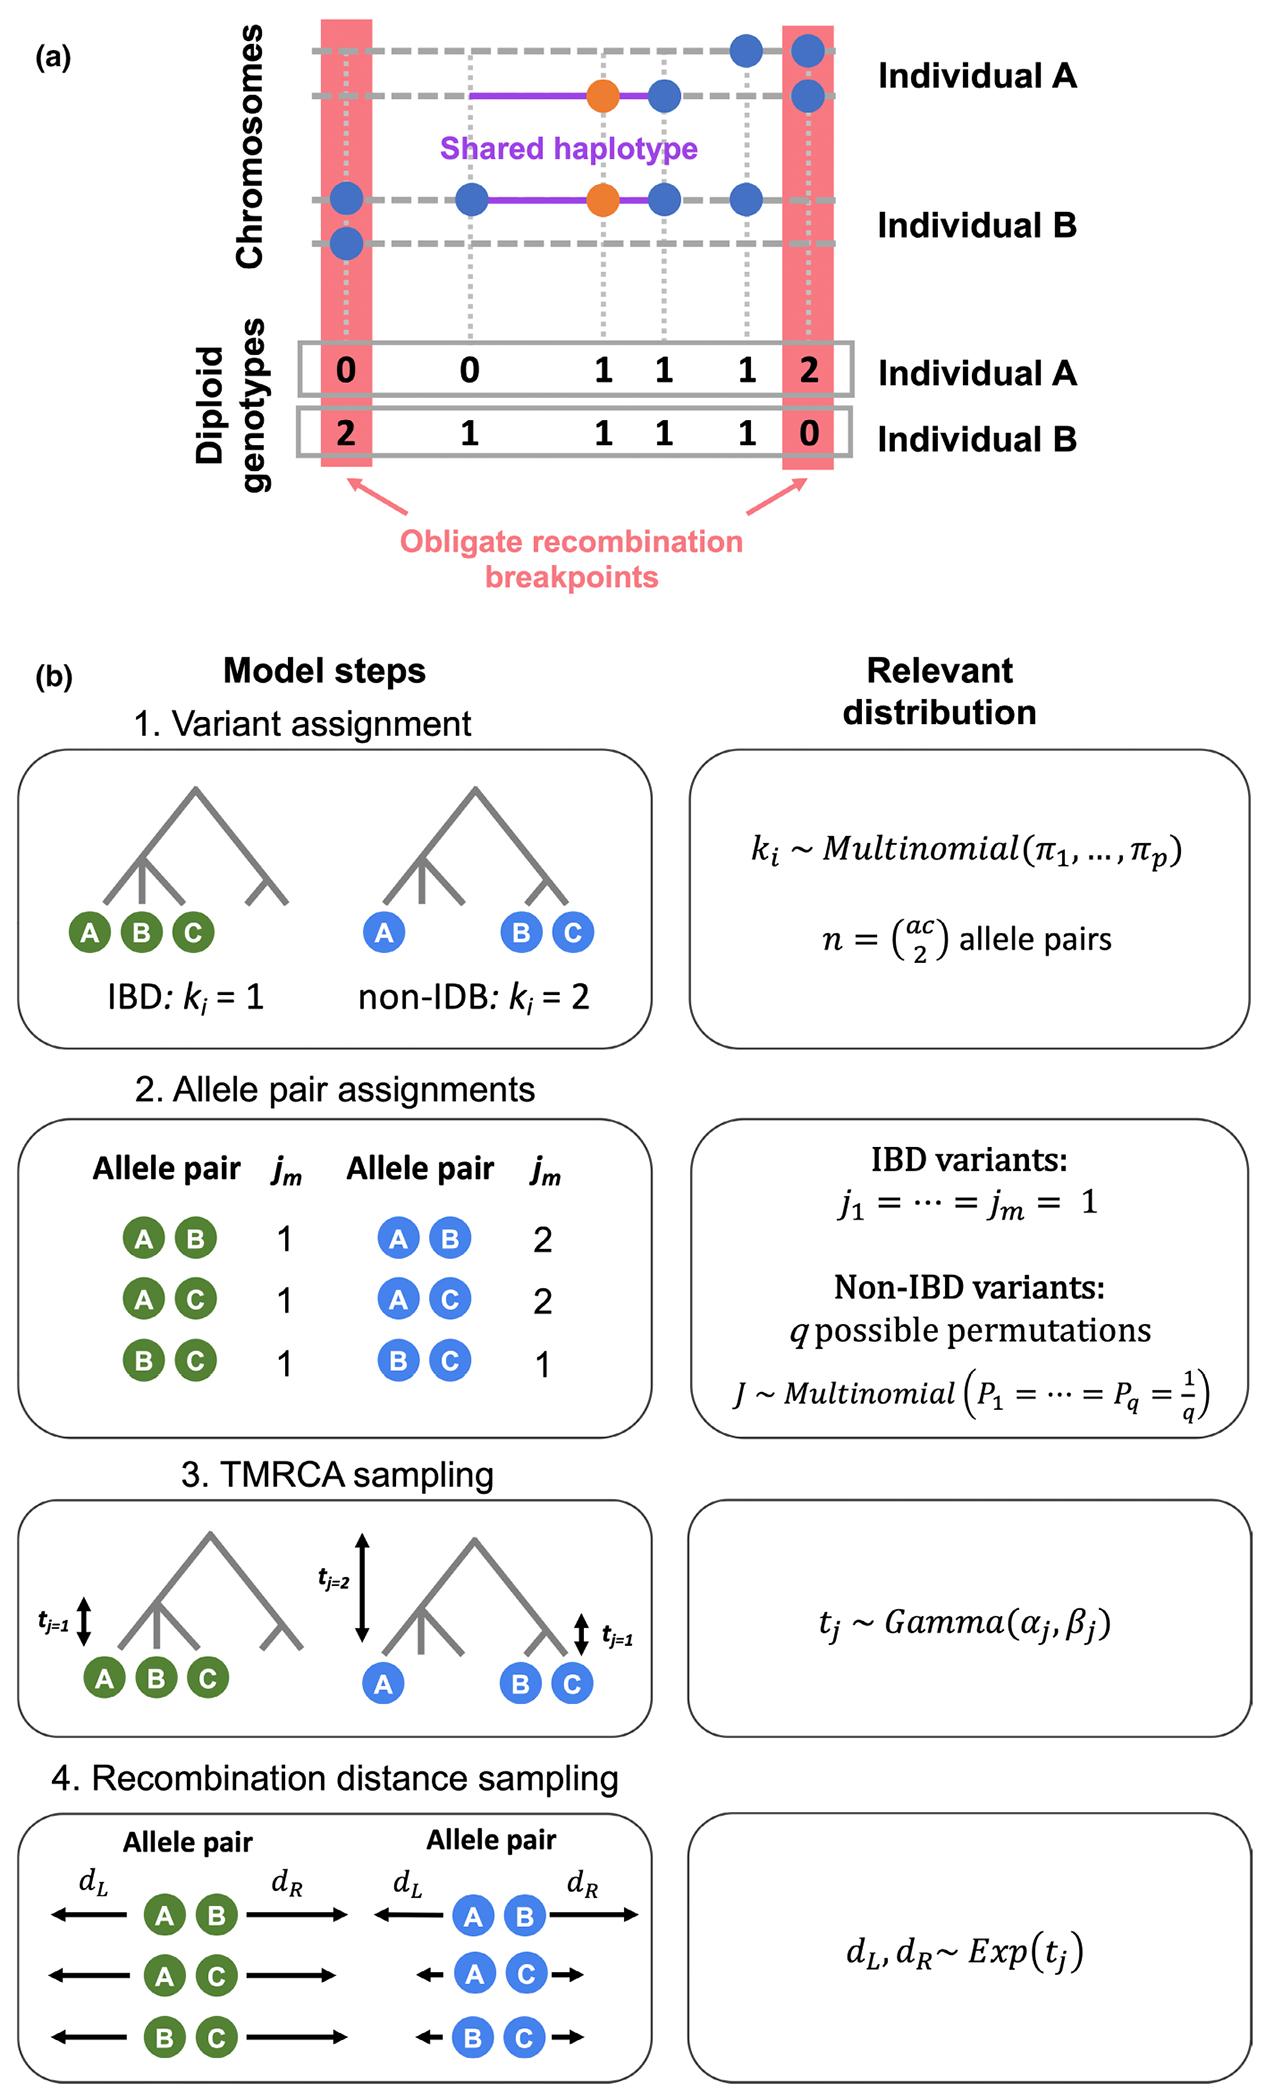
FIGURE 1.

Description of the EVICORD model. (a) Measuring the obligate recombination distance with unphased diploid genotypes. The orange dot represents the focal variant and blue dots additional variants present in these two individuals. Each individual A and B has two chromosomes (dashed lines), and the red boxes highlight the nearest opposite homozygote genotypes. The purple lines highlight the extent of the shared haplotype of the chromosomes carrying the focal variant. The boxes at the bottom illustrate these two individual’s diploid genotypes. (b) The generative model underlying our Bayesian hierarchical model to distinguish identity-by-descent (IBD)-consistent and inconsistent variants. Step 1: Each variant is assigned as IBD () or non-IBD (. Each variant has allele pairs, calculated from its allele count (ac). Step 2: If the variant is IBD , all allele pairs are also . If the variant is non-IBD, depending on the non-IBD partition there are possible permutations of assignments , each of which are equally likely. Step 3: For an IBD variant, a single time to the most recent common ancestor (TMRCA) is sampled. If the variant is non-IBD, a TMRCA for the non-IBD allele pairs is sampled (), and potentially a TMRCA for one or more IBD sub-clades ) depending on allele count and partition. Step 4: for each allele pair, recombination distances to the left and right are sampled independently.
