
FIGURE 3.
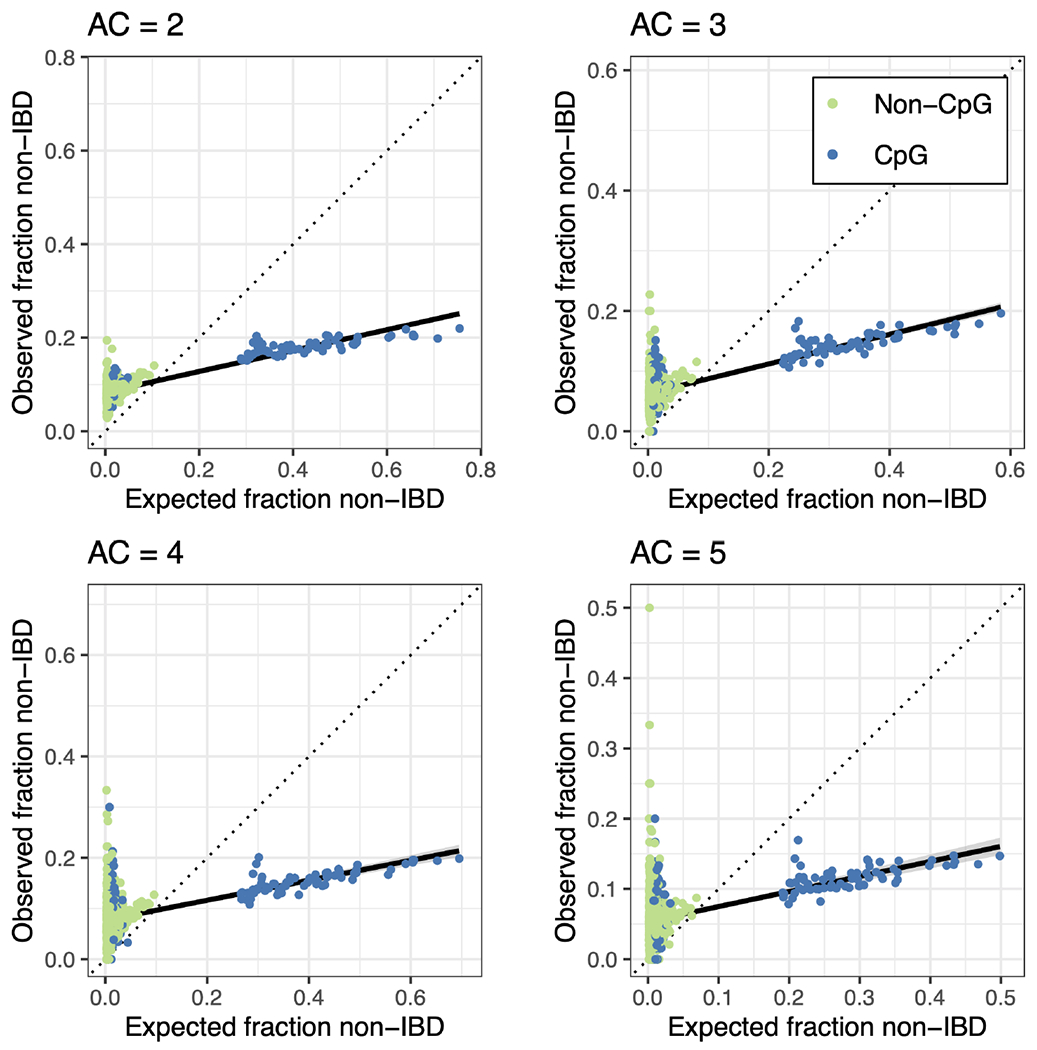
Calibration of EVICORD detected rates of identity-by-descent (IBD)-inconsistent calls in UK10K data. The expected and observed fraction of sites called IBD-inconsistent for UK10K variants, for allele counts (AC) 2–5. Each dot represents a 5-mer sequence context. Dot colours represent whether the sequence context is a CpG context (blue) or not (light green). The expected fraction was calculated from each sequence context’s polymorphism probability. The solid black line is a linear regression line for all sequence contexts, and the dotted line is the identity line.