
FIGURE 4.
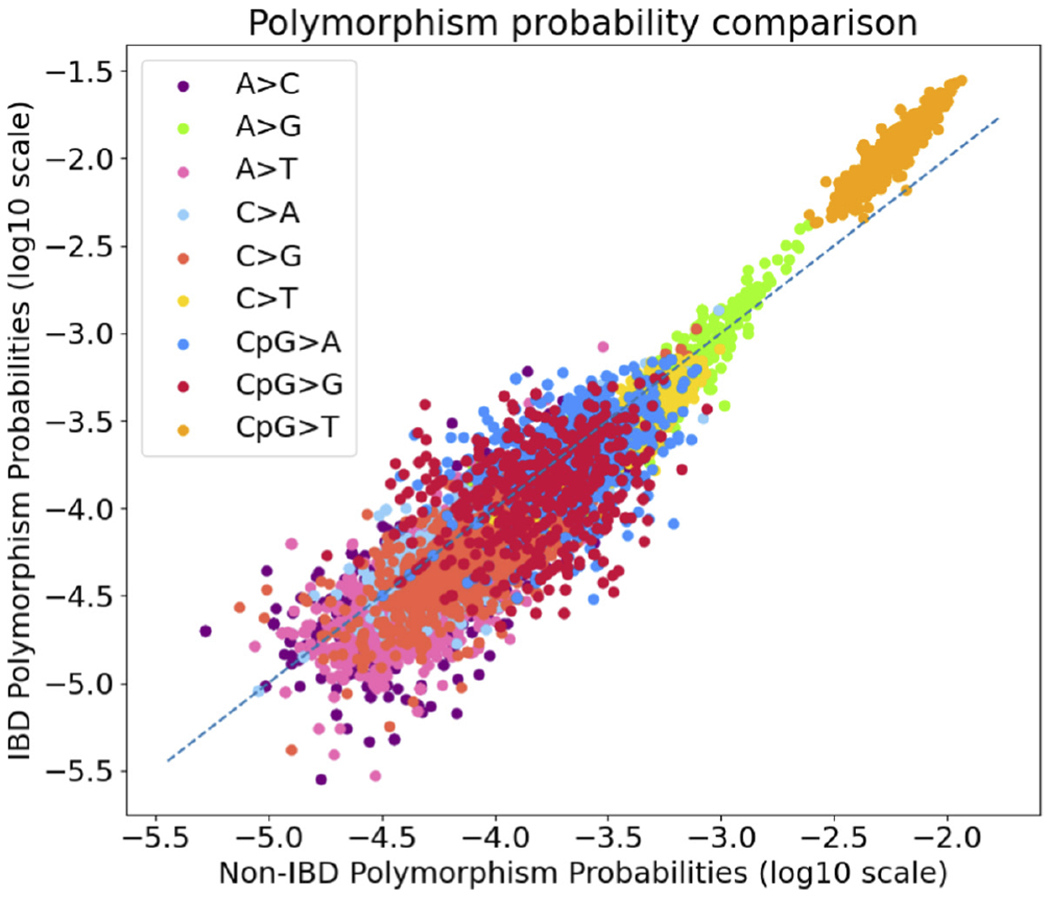
7-mer sequence context polymorphism probabilities for sites called identity-by-descent (IBD)-inconsistent vs. IBD-consistent for UK10K variants. Each dot represents the polymorphism probability estimated for each 7-mer sequence context using our dynamic programming algorithm. The dashed blue line represents the expected polymorphism probabilities under a model of no differences between IBD-consistent and inconsistent variants. Polymorphism probabilities were strongly rank correlated (Spearman’s correlation ).