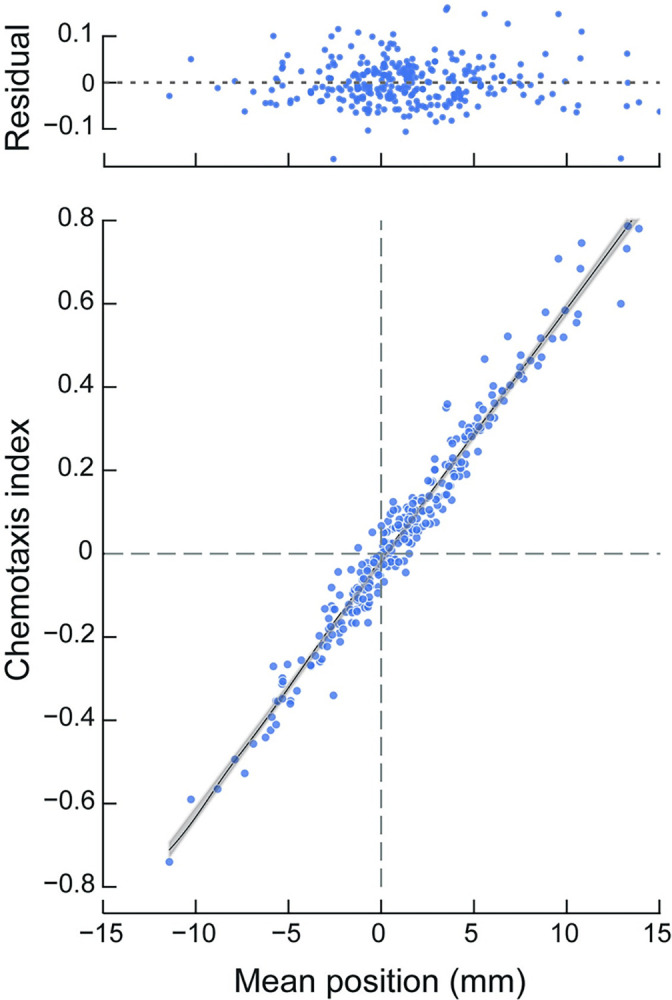
Fig 3. Chemotaxis index and mean worm position are similar across a range of values and test conditions.

Each point represents the chemotaxis index and mean worm position computed from a single assay. The dataset represents 288 assays of the response of wild-type worms to 96 compounds (N = 3 biological replicates). Black line is a least-squares fit to the data with a slope of 0.06 (R2 = 0.97), the gray shaded area shows the 95% confidence interval for the fit. The residuals of the fit (above) show the difference between the experimental and fitted values. Data used to calculate these statistics and generate this figure are reported in S2 Data.
