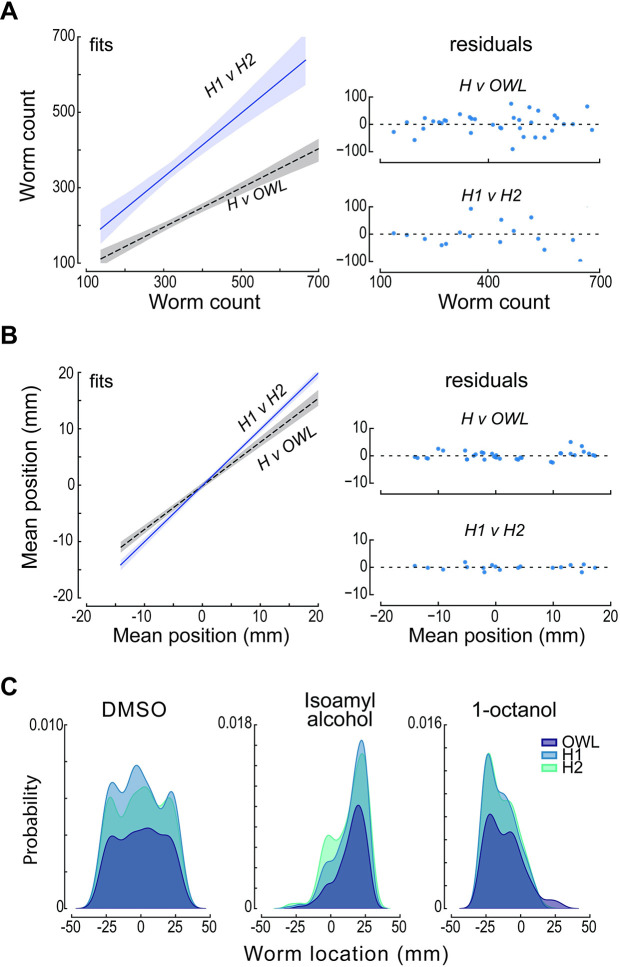
Fig 4. Performance of human scorers and OWL software.
(A) Relationship (left) between the total number of worms detected by humans, H1 and H2 (solid blue line, slope = 0.85 R2 = 0.83), and by the average human and OWL software (dashed black line, slope = 0.52; R2 = 0.81). Shaded areas show the 95% confidence intervals of the fit. The fit residuals (right) indicate no systematic effect of the number of worms. (B) Relationship (left) between the mean worm position detected by H1 and H2 (solid blue line, slope = 0.99; R2 = 0.99) and by the average human and OWL software (dashed black line, slope = 0.77; R2 = 0.96). Shaded areas show the 95% confidence intervals of the fit. The fit residuals (right) indicate no systematic effect of the mean position. The test dataset shown in (A) and (B) was derived from images of 19 assays (4 of diacetyl and 3 for all other conditions). (C) Density as function of distance along the chemical gradient for 3 conditions (left to right): null condition (DMSO:DMSO), a known attractant (isoamyl alcohol), and a known repellent(1-octanol). Distributions scored by humans (light blue and aqua) and determined by OWL software (dark blue) are similar. Each image in the test dataset (N = 3) was scored by 2 human experimenters and by the OWL software, as described in Methods. Data used to calculate these statistics and to generate this figure are reported in S3 Data.

