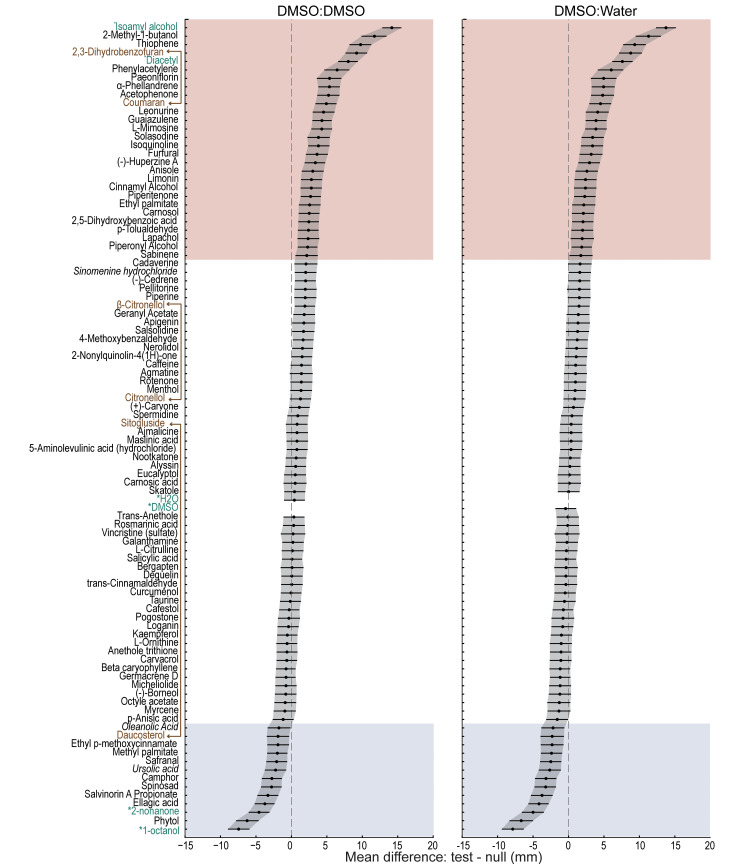
Fig 5. A screen of 96 conditions reveals 37 SMs that are chemoactive in wild-type C. elegans, evoking either attraction (pink) or repulsion (blue).
The chemical panel contained 90 plant SMs and 6 reference conditions (green text, asterisks: isoamyl alcohol, diacetyl, 2-nonanone, 1-octanol, DMSO, and water). Results are sorted (top to bottom) according to the difference in mean position relative to 2 null reference conditions: symmetric DMSO:DMSO (left) and asymmetric DMSO:water (right). Positive values correspond to attraction and negative values correspond to repulsion. Black points and lines are, respectively, the difference of the mean position in each test condition relative to the reference condition and the 95% confidence intervals of these values. Shaded areas indicate putative attractants (pink) and repellents (blue). The panel includes 3 pairs of nominally identical compounds (brown text connected with solid lines) and 3 compounds (italics) eliciting weak responses likely to be false positives after correcting for multiple comparisons. S2 Table reports the sample size (n = worms pooled across N = 3 biological replicates), the difference of the mean position (in mm) for wild-type (N2) in experimental vs. reference conditions (DMSO: DMSO and DMSO:water), 95% confidence intervals (5% CI, 95% CI), exact p-values, and correction for multiple comparisons (5% FDR, B-H). Individual data points underpinning these measurements are reported in S4 Data.

