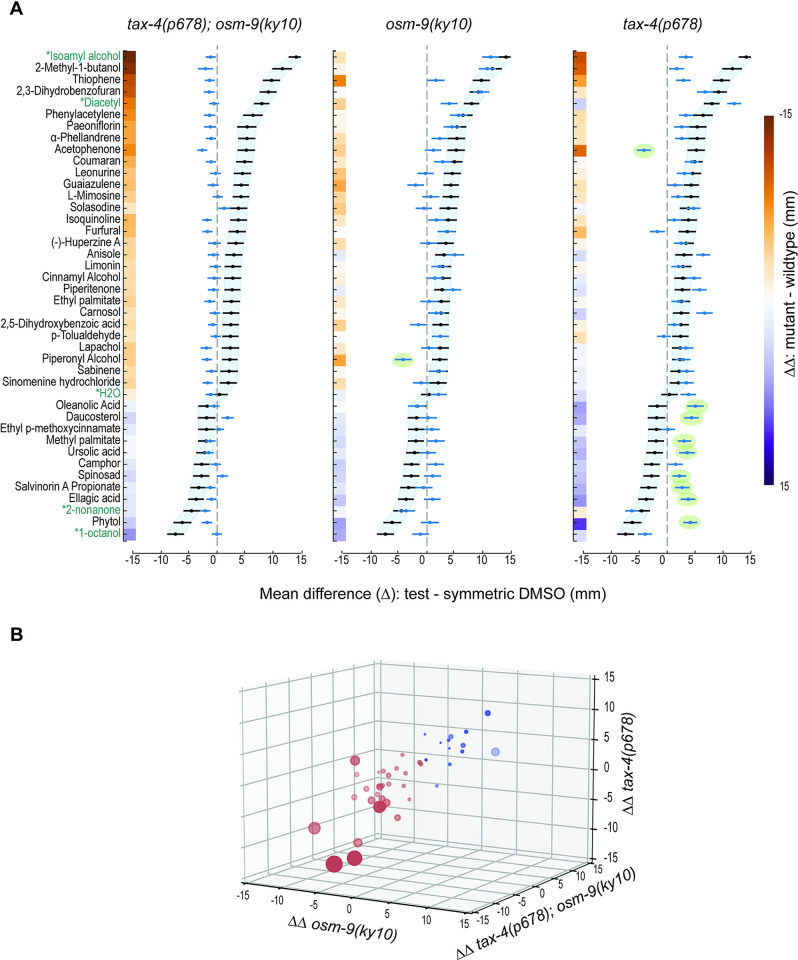
Fig 6. Chemoactive plant SMs evoke approach or avoidance based on signaling by CNG channels, TRPV channels, or both chemosensory ion channels.
(A) Bootstrapped difference in the mean position (±95% confidence interval) for each plant SM tested in tax-4(p678);osm-9(ky10) (left), osm-9(ky10) (middle), and tax-4(p678) (right) mutants. Blue points and lines represent the difference in bootstrapped mean position (±95% confidence intervals) for SM responses in mutants relative to symmetric DMSO, while black points and lines shaded in light blue represent the wild-type (N2) values (reproduced from Fig 5). Green ovals encapsulate responses in single mutants that are opposite in sign (valence) compared to the wild type. We computed ΔΔ values (mutant vs. wild type and SM vs. symmetric DMSO) via bootstrapping (Methods), encoded these values using the indicated color map, and displayed them along the y axis. (B) Three-dimensional plot of mean ΔΔ values for each mutant compared to wild type. SM valance is encoded in color: red symbols correspond to SMs that attract wild type, while blue symbols are SMs that repel wild type. The area of each symbol is proportional to the strength of attraction or repulsion; the more saturated the symbol color, the closer it is to the viewer in three-dimensional space. Thus, large, dark red symbols represent strong attractants with large negative ΔΔ values along the tax-4;osm-9 and osm-9 axes. Values plotted as points (mean difference) and lines (95% confidence intervals) in panel (A) are tabulated in S2 Table (wild type) and S3 Table (mutants: GN1077 tax-4;osm-9; CX10 osm-9; PR678 tax-4) along with sample size in worms pooled across 3 biological replicates. Mean ΔΔ values, 95% confidence intervals (5% CI, 95% CI) encoded in color bars in panel (A) and used to position SMs in the 3D space in panel (B) are reported in S4 Table. Data points underpinning these measurements are reported in S4 Data.

