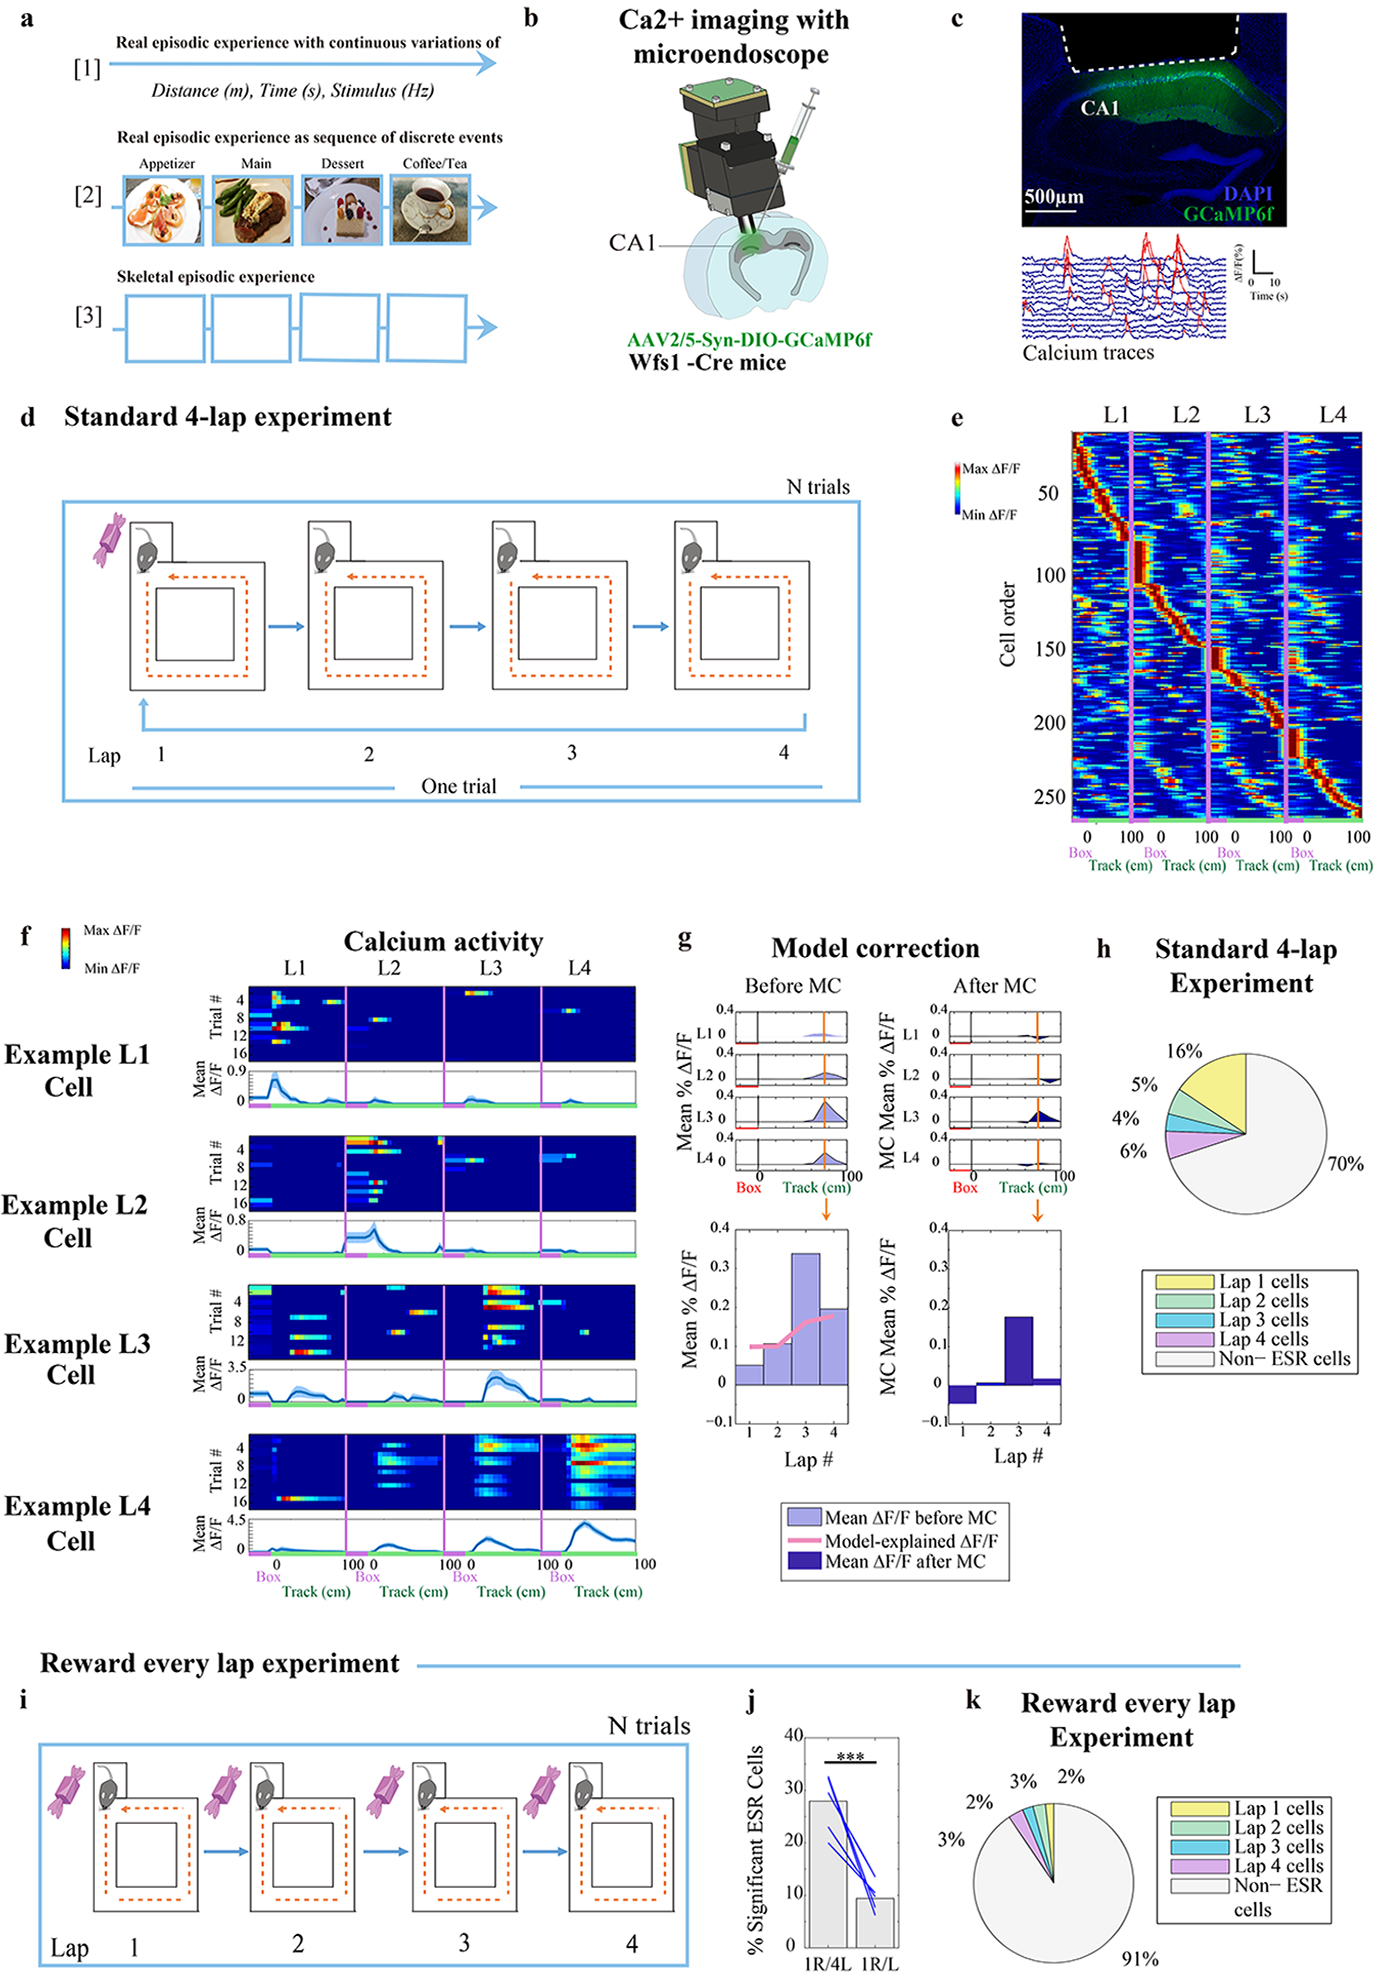
Fig. 1: Experimental design to study segmentation of experience into units.

a) Illustration of experience as (top): sequence of continuous, moment to moment variations in space, time, and sensory stimuli, (middle): sequence of discrete events as fundamental units of the experience. (bottom): our behavioral task as a skeletal experience stripped of sensory and spatial differences in order to identify neuronal representations that track event as fundamental units.
b) Implantation of microendoscope into dCA1 of Wfs1-Cre mice with AAV2/5-Syn-flex-GCaMP6f-WPRE-SV40 virus injected in dCA1 for imaging CA1 pyramidal cells.
c) Top: Coronal section of hippocampus showing area of cortex aspiration (white dotted line) and Wfs1+ cells labelled (green). Representative of aspiration surgeries from n = 14 mice. Bottom: ΔF/F calcium traces of n = 15 Wfs1+ (pyramidal) cells in CA1, where (red) denotes significant calcium transients identified.
d) During the standard 4-lap-per-trial experiment reward was delivered to the animal at the beginning of lap 1 in the reward box, once every 4 such laps.
e) CA1 calcium activity sorted by spatial position and lap number showed activity in the same place on every lap but displayed a higher activity level during a specific lap compared to other laps (263 cells from example animal). Red label on the x-axis indicates reward box spatial bin, and green label on the x-axis indicates the 100 cm long maze track.
f) Trial-by-trial calcium activity of example lap 1, 2, 3, and 4 preferring neurons, organized by location of activity along the track and by lap number. Top panel: trial-by-trial calcium activity; Bottom panel: trial averaged calcium activity (mean ±SEM). Standard error was cut off at 0 because negative activity does not exist).
g) Model correction of lap-dependent neuronal activity: Left, top: example neuron with raw calcium activity level (Light blue) sorted by lap number and spatial bin. Left, bottom: peak spatial bin to study lap-specific calcium activity, and plotted with calcium rate explained by the speed and head orientation fitted linear model (Pink trace, See Methods). Right: The same panels as the left, but plotted with lap specific remaining calcium rate after the linear model was subtracted, resulting in ‘model corrected’, or MC, calcium activity.
h) Summary statistics: Percentage of ESR cells in the whole CA1 pyramidal population that were tuned to lap 1, 2, 3, or 4, in the standard 4-lap experiment (n = 14 animals).
i—k) (i) Task schedule: reward was given to the animal every lap. (j) The percentage of significant ESR cells (101/1072 cells) was significantly reduced when reward was given every lap, compared with the same animals running the standard 4-lap-per-trial task (371/1328 cells) (χ2 =128.7, p < 10−16, Blue lines: 5 mice). (k) Summary statistics: Percentage of ESR cells in the whole CA1 pyramidal population that were tuned to lap 1, 2, 3, or 4, during the reward every lap experiment.
