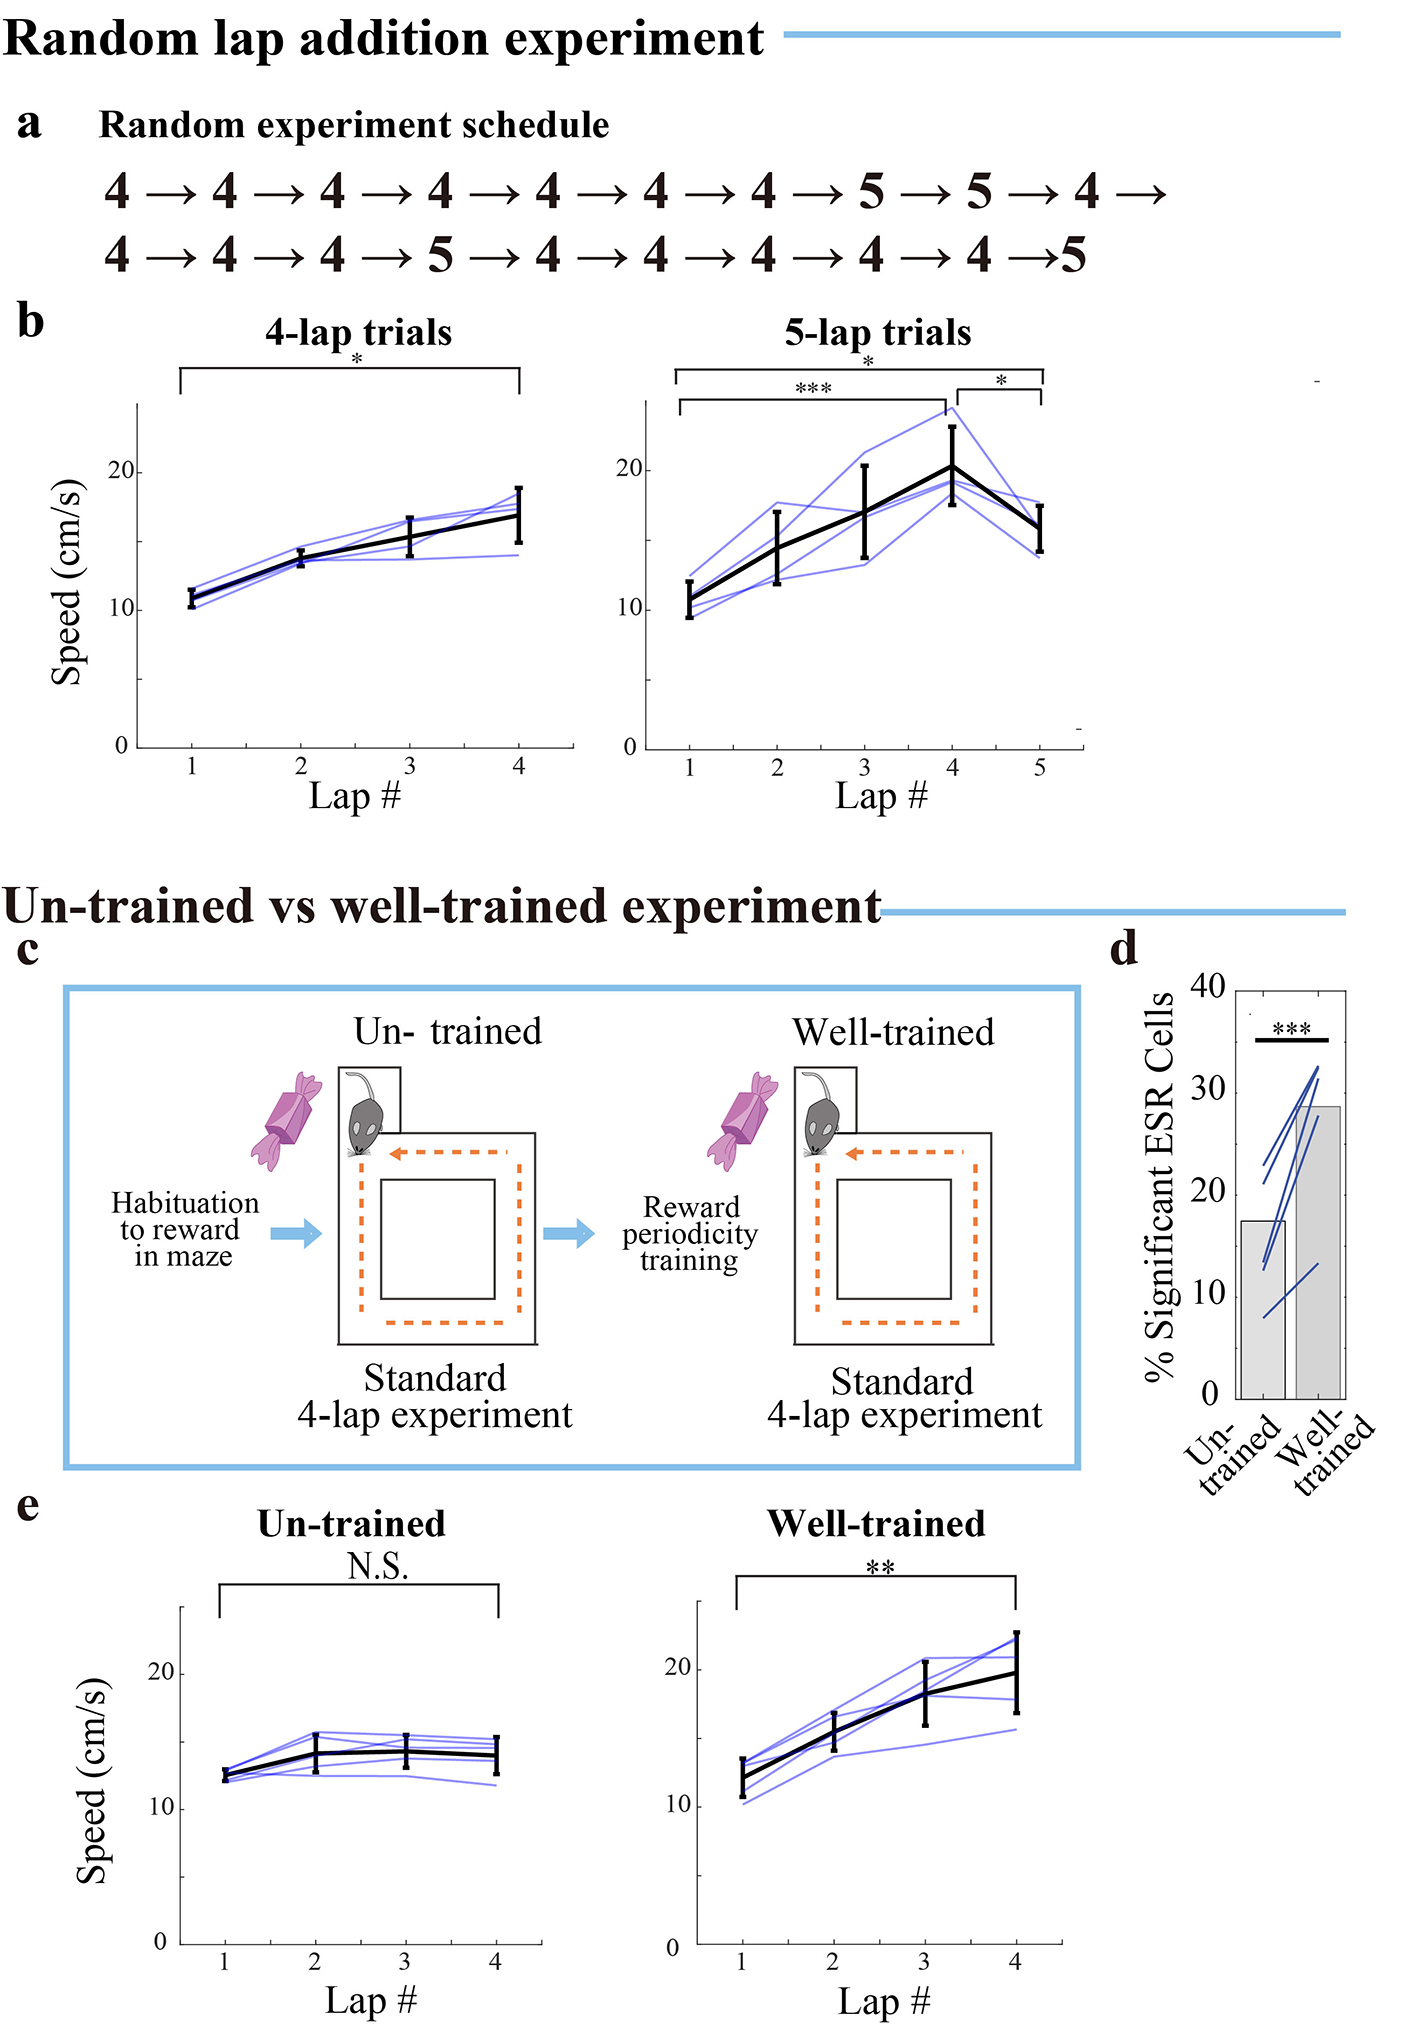
Extended Data Fig. 4: ESR is learning dependent and indicates recognition of lap number.

a) Pseudorandom experiment schedule: 20 trials in total where 4 pseudorandomly chosen trials had an extra (5th) lap before reward delivery.
b) Mean speed during active periods (defined > 4 cm/s) plotted separately for different lap numbers (left) during standard 4-lap trials (lap 4 vs lap 1: Paired T-test: tstat = 5.48, df = 3, p = 1.2*10−2), and (right) during the unexpected 5-lap trials for the same n = 4 mice (mean ± SD). (One-way ANOVA: F(2,9) = 22.48, p = 0.0003. Tukey-Kramer post-hoc analysis for lap 4 vs lap 1: p = 2.3*10−4, lap 4 vs lap 5: p = 2.9*10−2, lap 1 vs lap 5: p = 1.5*10−2). Blue lines indicate speed of individual mice.
c) Experimental schedule for un-trained vs well-trained animals on the standard 4-lap-per-trial task.
d) The percentage of significant ESR cells was significantly less during un-trained session (176/1008 cells) comparing with well-trained session in the same mice (335/1168) (χ2 =37.9, p = 7.4*10−10; Blue lines: 5 mice).
e) Mean active speed (active periods defined > 4 cm/s) plotted separately for different lap numbers (left) in un-trained animals (lap 4 vs lap 1: Paired T-test: tstat = 2.29, df = 4, p = 0.084), vs (right) the same well-trained animals (n = 5 mice, mean ± SD) (lap 4 vs lap 1: Paired T-test: tstat = 6.42, df = 4, p = 3.0*10−3). Blue lines indicate speed of individual mice.
* denotes p < 0.05, ** denotes p < 0.01, *** denotes p < 0.001, N.S. not significant.
