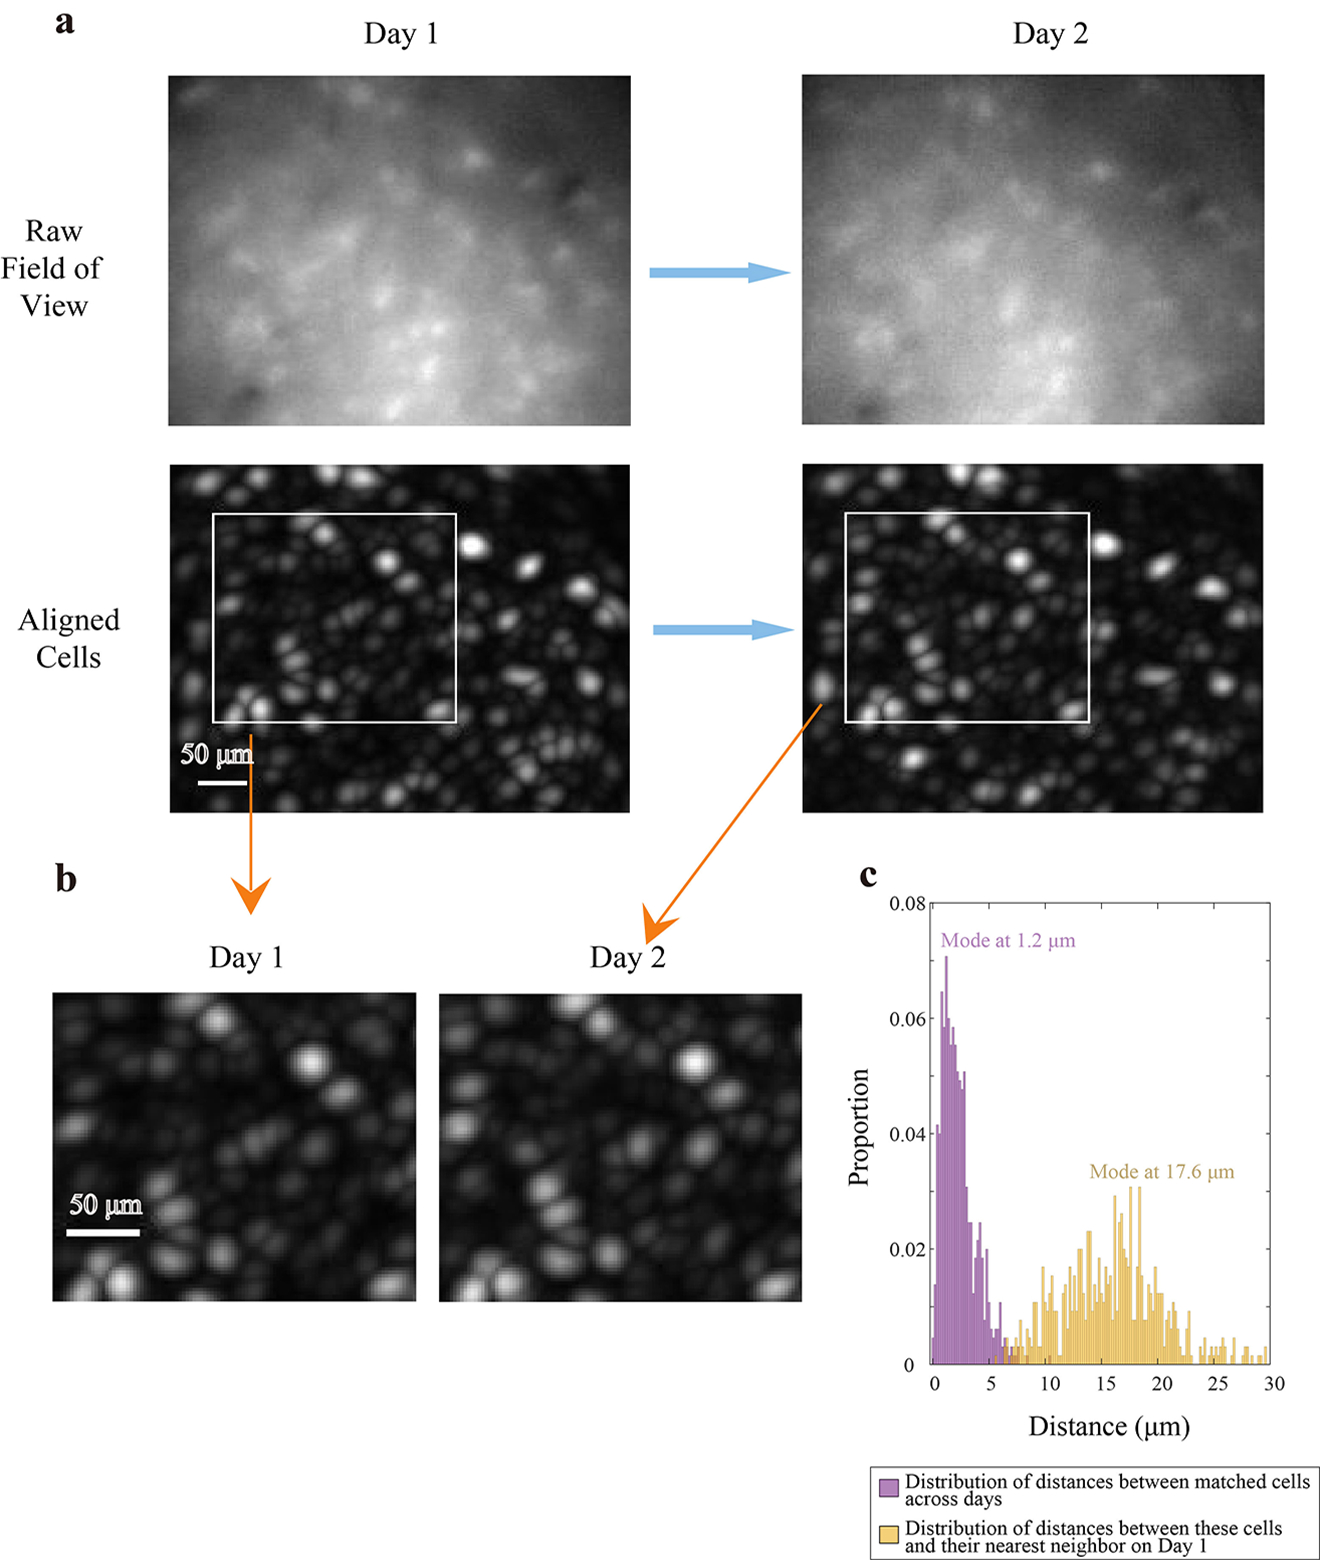
Extended Data Fig. 5: Method for image registration across days.

a) Field of view of raw endoscopic image (Top) during day 1 (Left) and day 2 (right) in one example animal. Corresponding locations of cells (Bottom) during the same two sessions, as seen in max projection images after motion correction. Representative of images from n = 4 mice.
b) Expanded view of aligned cell locations on day 1 and day 2 from (a).
c) Purple: Distances between active cells on Day 1 and their putatively matched cells on Day 2 (650 cells, n = 4 animals). Yellow: Distances between the same cells and their nearest neighbor within Day 1. Plot is cut off at 30μm.
