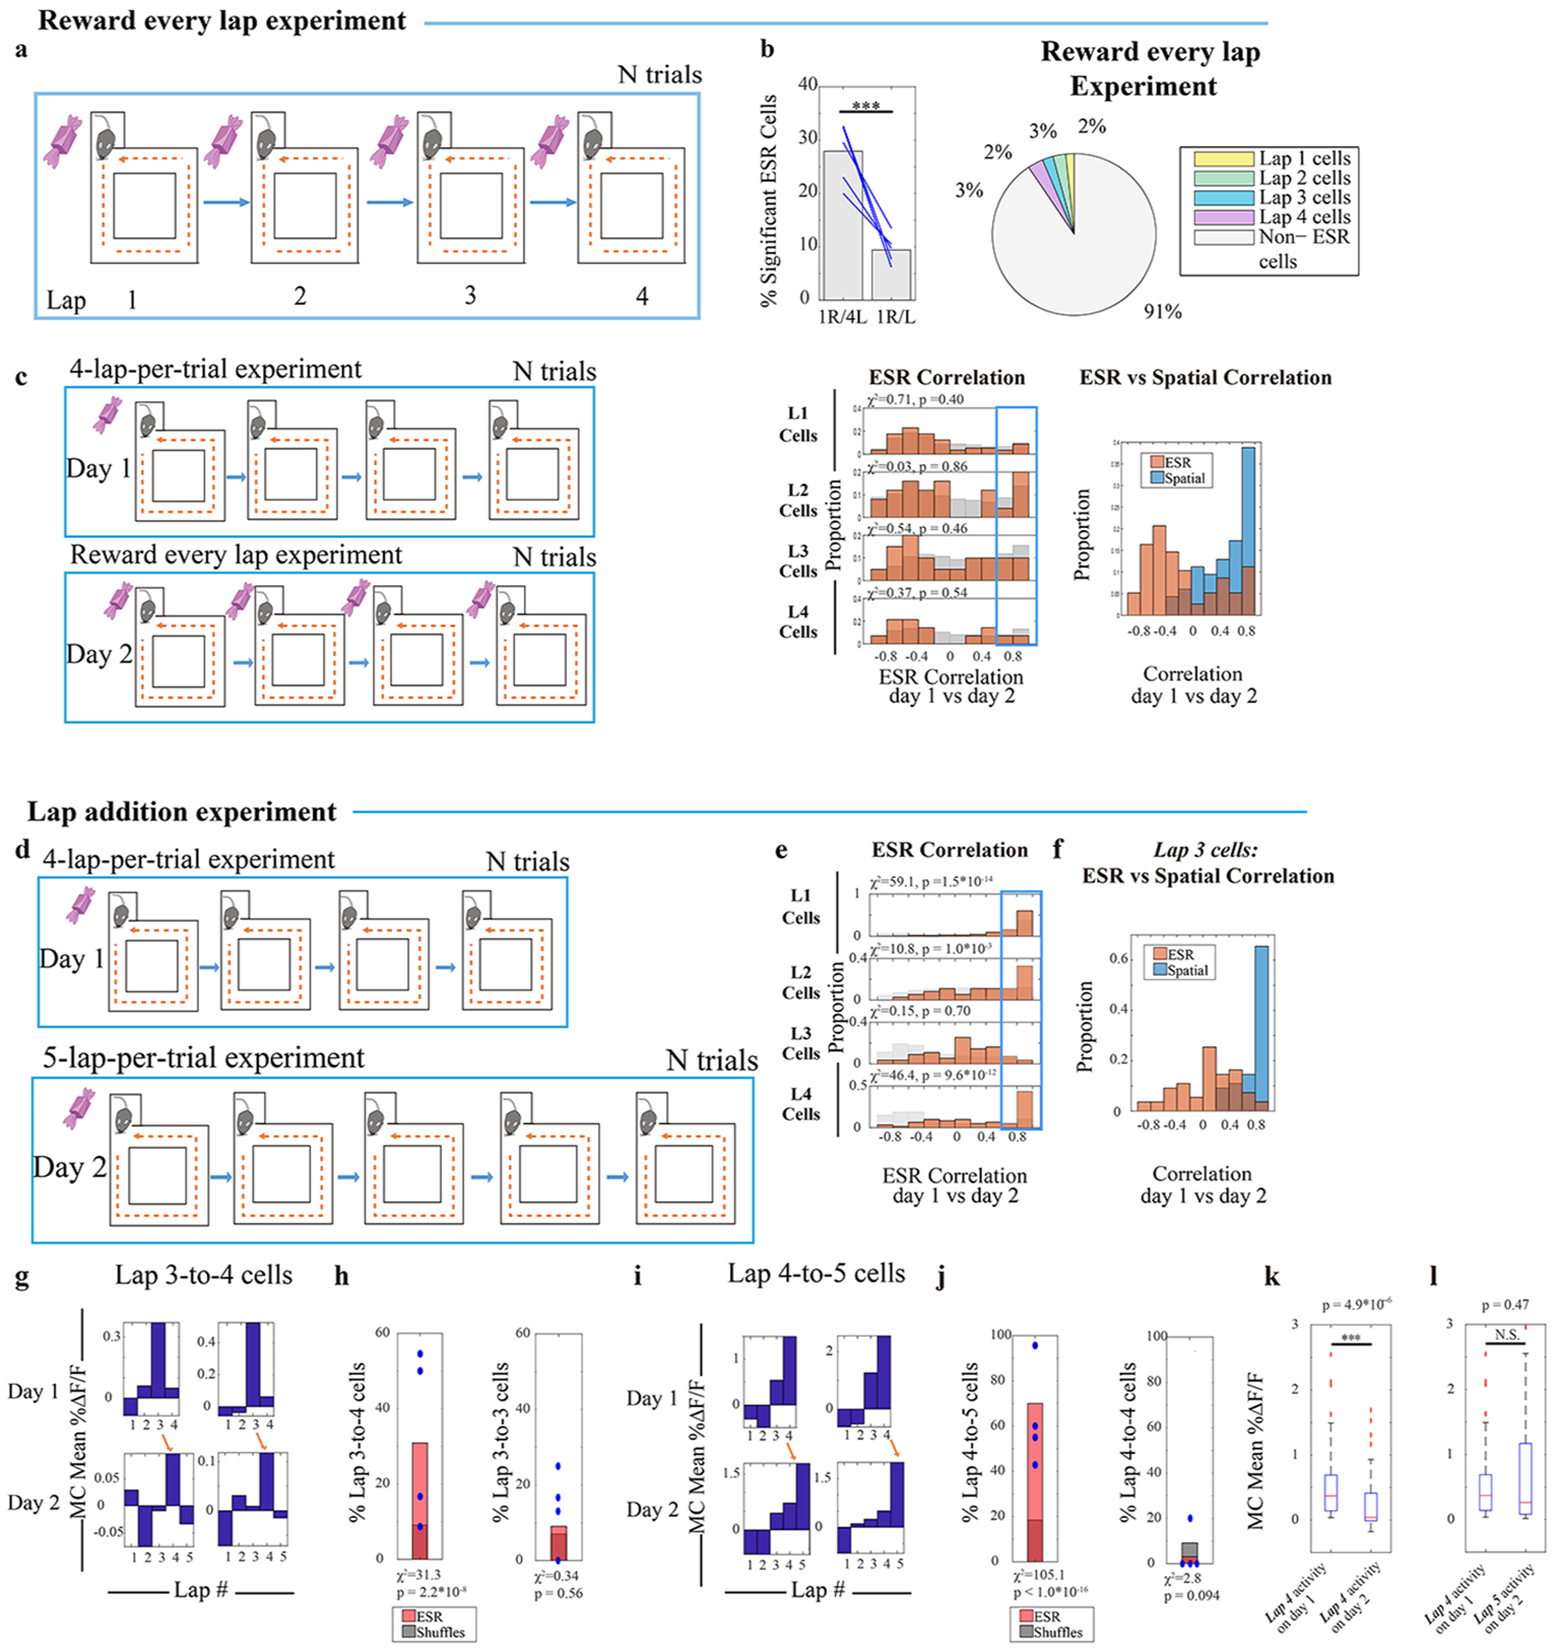
Fig. 5: ESR tracks the relationships between events.

a—c) (a) Day 1: standard 4-lap-per-trial experiment and Day 2: reward every lap experiment. (b) ESR correlations across the standard 4-lap vs reward every lap experiment (134 cells, n = 3 mice). See Fig. 2(e) for description and methods. (c) Individual cells showed high spatial correlation while ESR representations were perturbed during the 4-lap vs reward every lap experiment (134 cells).
d) Lap addition experiment: Day 1: standard 4-lap-per-trial experiment and Day 2: 5-lap-per-trial experiment.
e) ESR correlations across the 4-lap and 5-lap experiment sessions (382 cells, n = 4 mice). See Fig. 2(e) for description and methods.
f) Individual Lap 3 cells showed high spatial correlation while ESR representations were perturbed, during the lap addition experiment (55 cells, n = 4 mice).
g) Two example neurons matched across 4-lap and 5-lap experiment sessions that transformed from lap 3 to lap 4 preference.
h) Percentage of cells that transformed from lap 3 to lap 4 preference (17/55 cells total, Blue marks: 4 mice).
(i) Two example neurons matched across 4-lap and 5-lap experiment sessions that transformed from lap 4 to lap 5 preference. (j) Percentage of cells that transformed from lap 4 to lap 5 preference (42/60 cells total, Blue marks: 4 mice). (k) MC activity of these cells from (j) during lap 4 on day 1 was significantly decreased during the same lap on day 2 (42 cells, Wilcoxon signed rank test: z= 4.57, p = 4.88*10−6). (l) MC activity of these cells from (j) during lap 4 on day 1 was not statistically different from MC activity during lap 5 on day 2 (42 cells, Wilcoxon signed rank test: z= −0.72, p = 0.47). Box and whisker plots display median, 25th and 75th percentiles (box), and maximum and minimum values (whiskers). * denotes p < 0.05, *** denotes p < 0.001, N.S., not significant.
