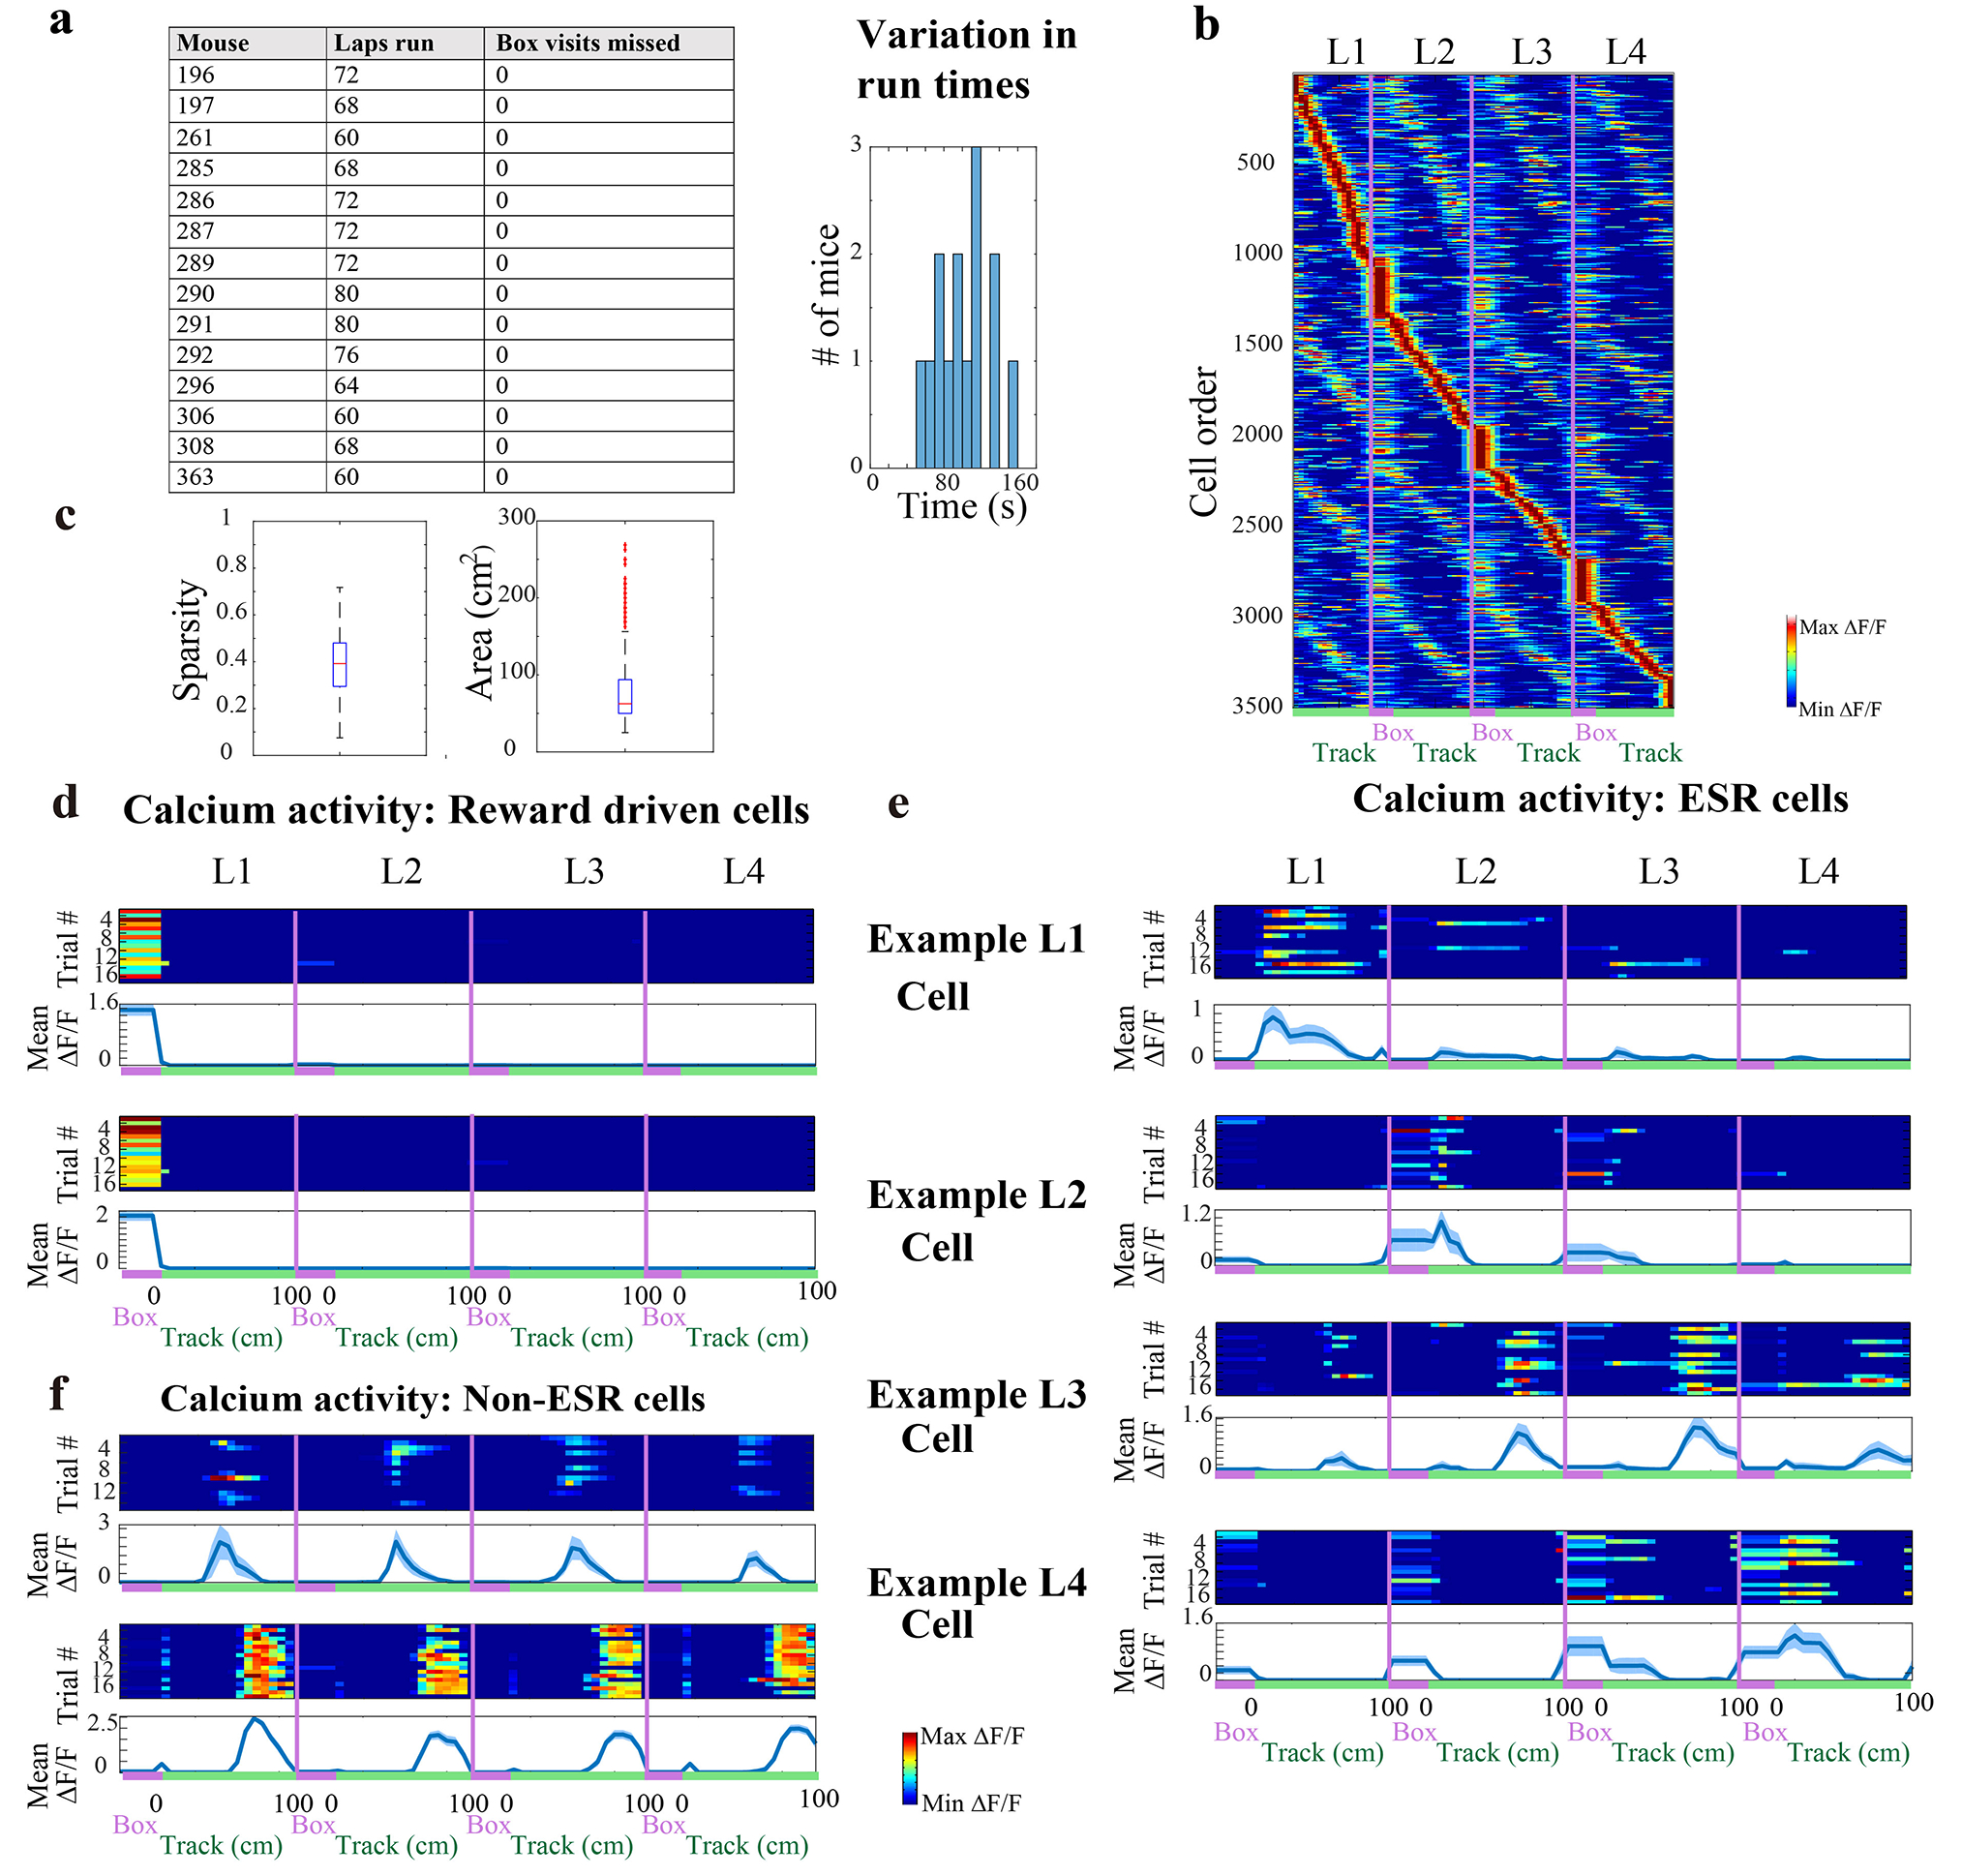
Extended Data Fig. 1: Spatial and Reward properties of CA1 cells on the maze.

a) Left: Summary of mice running in a single session of the standard 4-lap-per-trial task. Mice did not miss a visit into the reward box on any run. Right: Mean run time among trials (n = 14 animals)
b) CA1 calcium activity sorted by spatial position and lap number (3506 cells, n = 14 animals). Red label indicates reward box spatial bin, and green label indicates the 100 cm long maze track. Reward box activity during lap 1 (reward eating period) was excluded.
c) Characterization of mean spatial properties of CA1 cells active in the lap maze: Left: sparsity, and Right: spatial field size; n = 14 mice. In total, 72% (2509/3506) of CA1 cells from 14 animals were significant place cells. Box and whisker plots display median, 25th and 75th percentiles (box), and maximum and minimum values (whiskers).
d—f) Spatially binned calcium activity along the track (d) 2 example cells that responded to the reward, and (e) One example lap 1, 2, 3, and 4 cell each, and (f) 2 example place cells that did not have lap modulated activity. Top panel: trial-by-trial activity Bottom panel: trial-averaged activity with mean ± SEM. The number of trials for each cell is indicated in each figure panel (d—f). Standard error was cut off at 0 because negative activity does not exist.
