Figure 4:
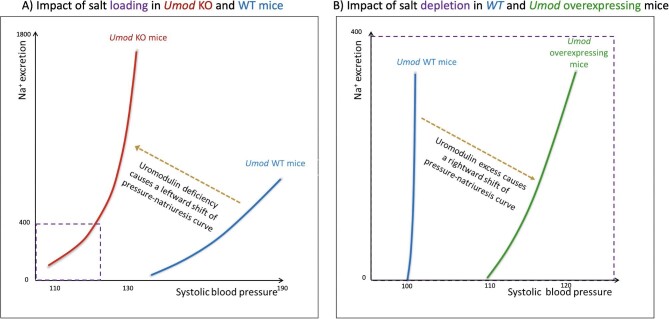
Uromodulin and the pressure-natriuresis curve. (A) Uromodulin deficiency causes a leftward shift of pressure-natriuresis curve compared with wild-type (WT) mice when mice are salt-overloaded (2% NaCl in drinking water), indicating that uromodulin deficiency results in the loss of the sodium-sensitivity of blood pressure observed in normal (WT) mice: in the presence of uromodulin, higher sodium intake results in higher blood pressure values than in absence of uromodulin (modified from Graham et al. [92]). (B) Uromodulin overexpression causes a rightward shift of pressure-natriuresis curve compared with WT mice when mice are salt-depleted (20-fold decrease in dietary NaCl), indicating that uromodulin excess results in the acquisition of the sodium-sensitivity of blood pressure. On the contrary, in normotensive WT mice no effect on BP is evident under these experimental conditions (figure drawn with data from Trudu et al. [16]). Na+ excretion in µmol/24 h and systolic blood pressure (SBP) in mmHg. Inset in (A) displays the dimensions of panel (B). Notice that studies in panels (A) and (B) used different mouse strains and protocols.

