
Figure 3.
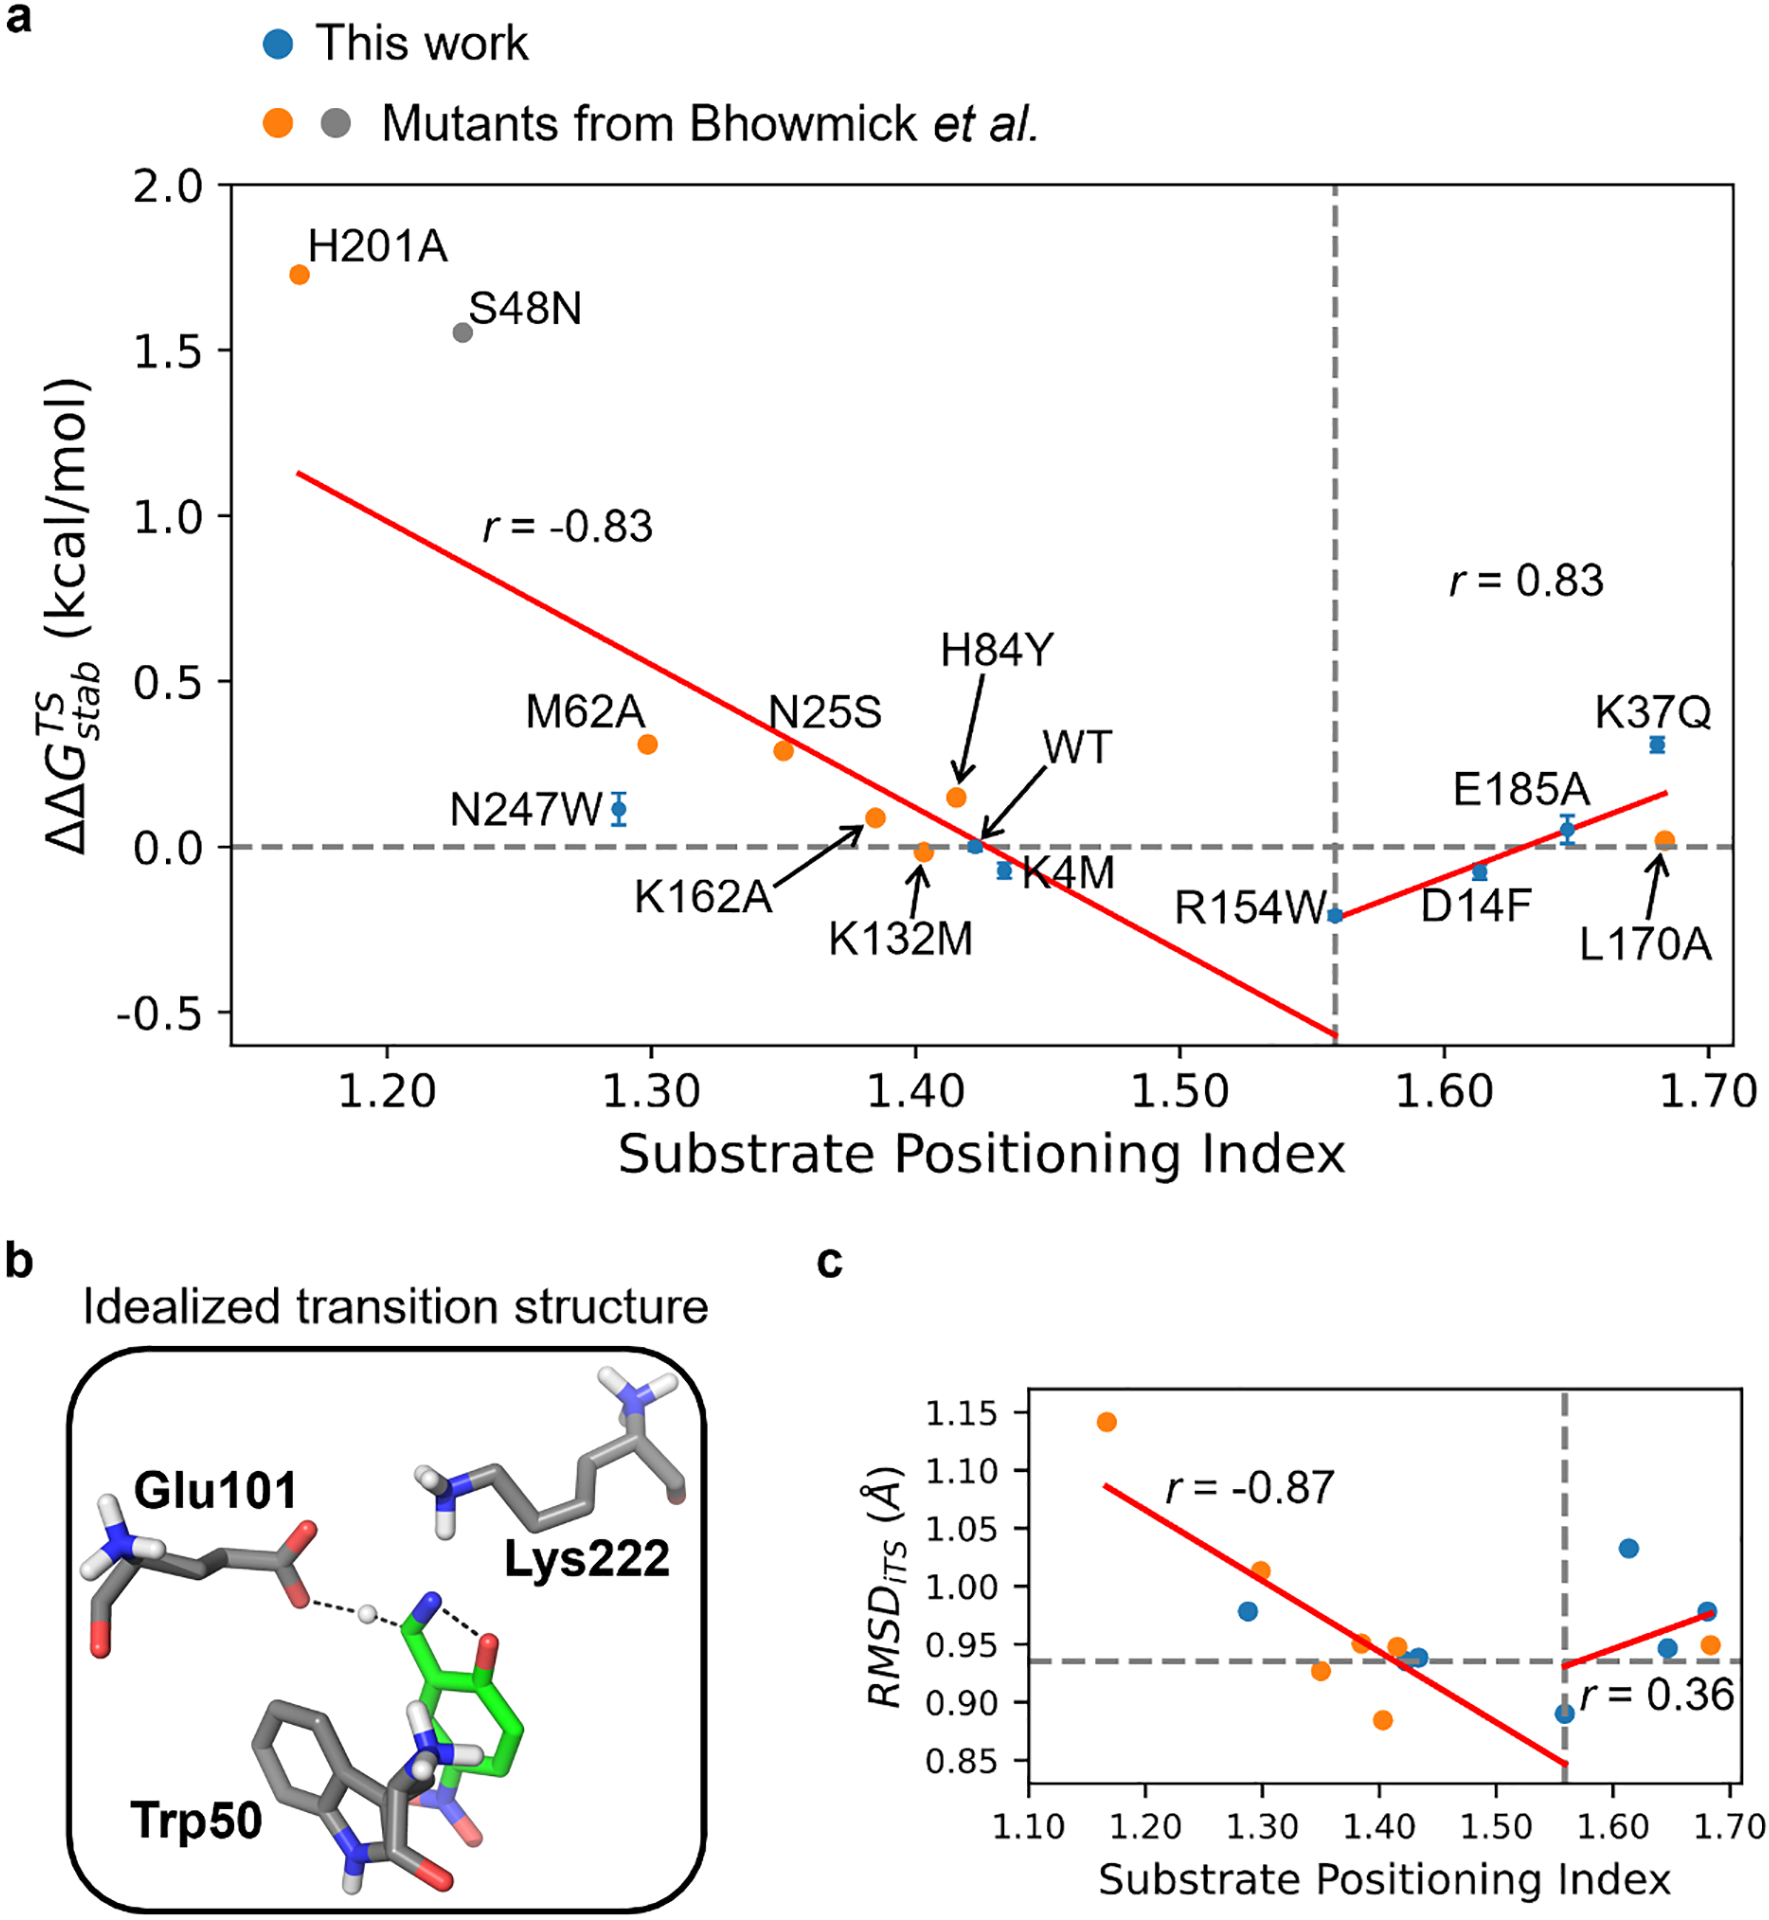
The impact of substrate positioning dynamics on the activation barrier and reaction conformation for KE07-R7–2 variants that are experimentally tested in this work (blue) and reported by Bhowmick et al.35 (orange and gray). (a) The correlation between change of activation free energy versus the substrate positioning index (SPI). For each data point tested in this work, the mean and standard error (shown as the vertical error bar) are derived from three independently repeated kinetic measurements. The horizontal dashed line indicates the position of . The vertical dashed line indicates the position of SPI = 1.56 where the beneficial mutant R154W is located. The vertical dashed line is also the boundary of the two-segment piecewise linear fitting. The fitting lines are shown in red and labeled with the corresponding Pearson correlation coefficient (r). The data point of R154W is included in both fitting lines. S48N is not included in the fitting because its electric field strength is outside the selection window of ±2.88 MV/cm. (b) Structure of the idealized transition state optimized from QM calculations.74 The dashed lines indicate the breaking or forming bonds. (c) Scatter plots for the root-mean-square deviation from the idealized transition state, i.e., RMSDiTS versus SPI of the selected KE07-R7–2 variants. The dashed and red lines are drawn similarly to (a). The horizontal dashed line indicates the value of WT RMSDiTS (0.94 Å).