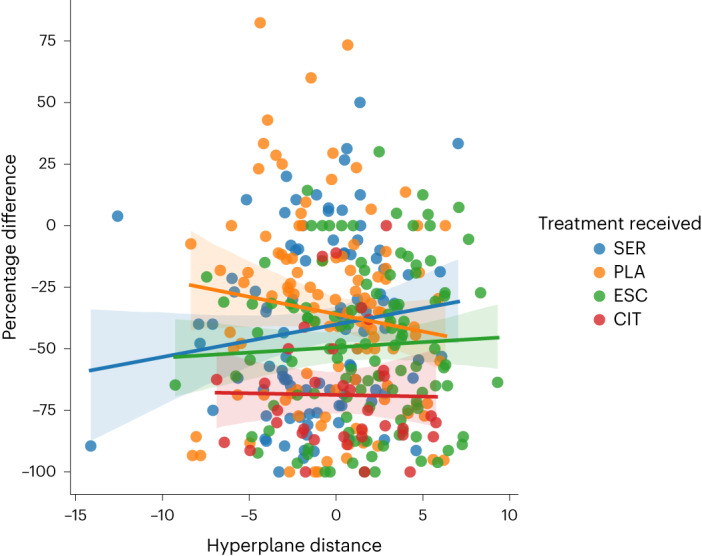
Fig. 4. Relationship between dimension membership and change in depressive symptoms following treatment.

Relationship between the support vector machine hyperplane (x axis) distance for each participant and the percentage change in HAM-D scores (y axis) following treatment with sertraline, escitalopram, citalopram, or placebo. Positive and negative values represent the distance from the hyperplane separating patients into D1 and D2. The larger the value, the more certain the classification within that dimension. Linear regression model shows a significant interaction between hyperplane distance and sertraline treatment (β = 2.73, P = 0.046 (two-sided), 95% CI (0.04 to 5.4). The shaded areas represent the 95% confidence intervals.
