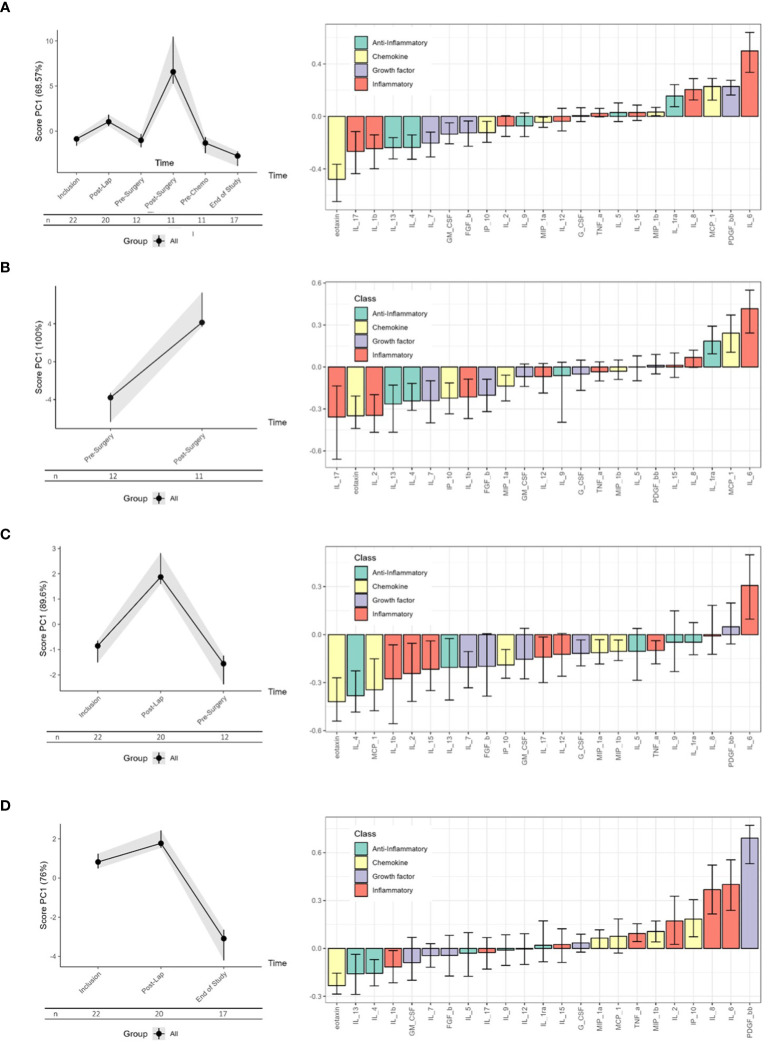
Figure 3.
RM-ASCA analyses of longitudinal changes in the serum cytokine levels in all patients (n = 22). The waterfall plots (right panels) illustrate the longitudinal changes in the serum levels of each cytokine according to their contribution to the principal component (PC)1 scores (left panels). Higher scores correspond to decreased levels of cytokines with negative loading and higher levels of cytokines with positive loading. (A) All the patients and all the visits are presented (n = 22). (B) Changes related to cytoreductive surgery only (n = 11). (C) Changes related to laparoscopic surgery only (n = 20). (D) Overall treatment-related changes (n = 17). Only visits occurring in both study groups are included. Cytokine functional groups are color-coded as indicated, and black lines within the bars represent the 95% confidence interval.

