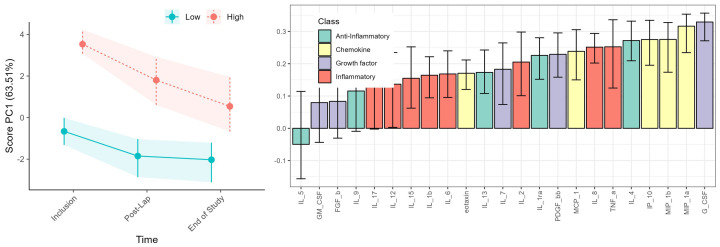
Figure 4.
RM-ASCA analysis illustrating cytokine trajectories categorized into Immune High (red) (n = 13) and Immune Low (green) (n = 9) patients. Both time and cytokine level variations are depicted, but the waterfall plots (right) primarily highlight the differences between the patient immune groups as these persists during the study period. Cytokine functional groups are color-coded as indicated, and black lines within the bars represent the 95% confidence interval.

