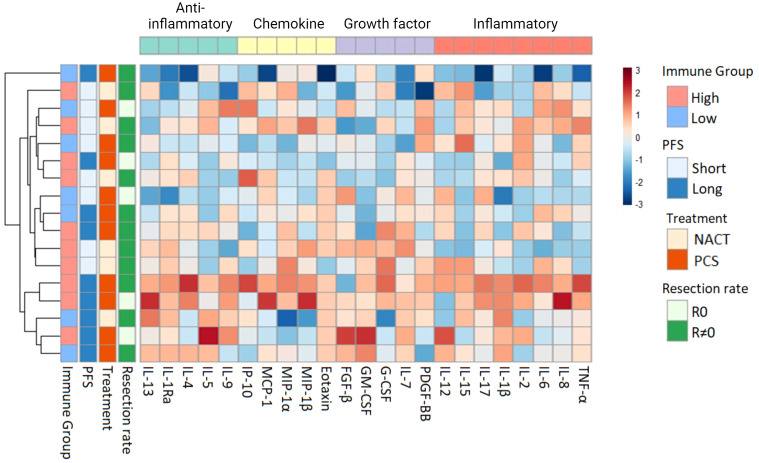
Figure 5.
Heatmap with unsupervised hierarchical clustering of all patients (n = 17) at the end of study. Each row represents one patient. The blocks to the left are color coded according to the predefined relevant subgroups (53). The cytokine classes are shown at the top. The color scale represents the serum concentrations of cytokines, with lower concentrations in blue and higher concentrations in red. The color scale is relative and scaled for inter-individual differences between patients for each cytokine. NACT, Neoadjuvant chemotherapy; PCS, Primary cytoreductive surgery; PFS, Progression-free survival; R0, Complete cytoreductive surgery; R≠0, Residual tumor after surgery.

