FIG. 4.
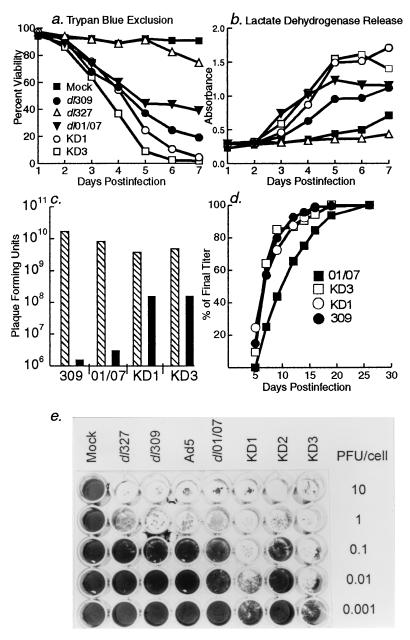
KD1 and KD3 lyse cells and spread from cell to cell efficiently. (a and b) A549 cells were infected with 20 PFU of the indicated viruses per cell, and then at the indicated days p.i. they were assayed for cell lysis by trypan blue exclusion (a) or release of lactate dehydrogenase into the medium (b). (c) A549 cells were infected with 20 PFU of virus per cell, and then at 2 days p.i. the amount of virus within the cells (hatched bars) and in the culture supernatant (black bars) was determined by plaque assay on A549 cells. (d) Plaque development assay on A549 cells. The number of plaques seen on a given day of the assay (x axis) is plotted as a percentage of plaques seen on the final day of the assay (y axis). (e) Virus spread assay. A549 cells were infected with different viruses, as indicated above the columns, and with different amounts of virus, as indicated beside the rows. At 7 days p.i., cells remaining on the plate were fixed and stained with crystal violet. Note the comet-shaped plaques of missing cells formed by KD1 and KD3 at 0.001 PFU/cell; each plaque arose from a single virus.

