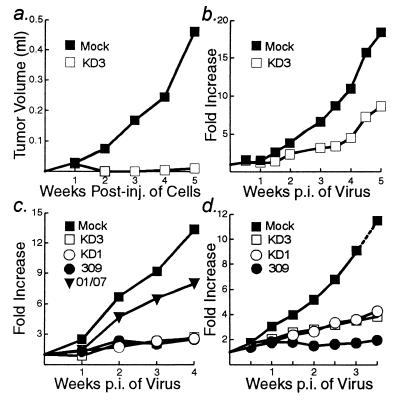
FIG. 6.
KD1 and KD3 reduce the growth of human tumors in nude mice. In all experiments, 107 cells were injected into each hind flank of nude mice. (a) A549 cells were mock infected or infected with KD3 (10 PFU/cell). After 3 h, the cells were trypsinized and added to trypsinized uninfected A549 cells such that 1 of 10,000 cells was infected. Cells were injected, and tumor growth was measured over 5 weeks. P = 0.007. (b) A549 cells were injected. When the tumors reached about 50 to 70 μl, they were injected with DMEM (mock) or KD3 (5 × 10⁸ PFU). The fold increase in tumor size was measured over 5 weeks. P = 0.048. (c) Same as in panel b except that tumors were measured and then injected with 5 × 10⁷ PFU of the indicated viruses on day 0 and at weeks 1, 2, and 3. For the following comparisons P was as indicated: KD3 and mock, 0.015; KD1 and mock, 0.015; 309 and mock, 0.014; dl01/07 and mock, 0.107; KD3 and dl01/07, 0.010; KD3 and KD1, 0.473; KD3 and 309, 0.461. (d) Hep 3B cells were injected. When tumors reached about 100 μl, they were injected with 5 × 10⁷ PFU of the indicated viruses on day 0 and twice per week until 3 weeks. For the following comparisons, P was as indicated: KD3 and mock, 0.030; KD1 and mock, 0.017; 309 and mock, 0.002; KD3 and KD1, 0.282; KD3 and 309, 0.003; KD1 and 309, 0.029.

