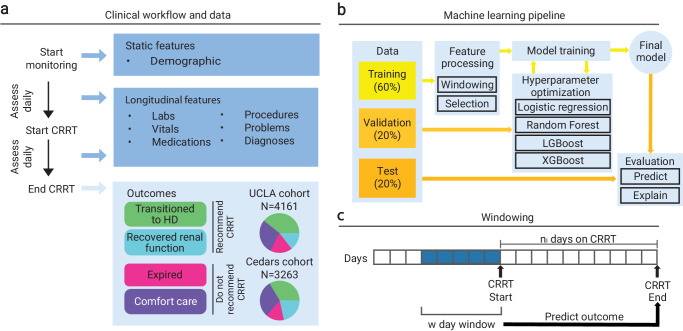
Fig. 1. Overview of study design and machine learning framework.
a Data and outcome labels. We collected two cohorts of data consisting of patients put on CRRT from the UCLA and Cedars Sinai hospital systems. We collected static features once at the outset of initiating CRRT. We collected longitudinal features multiple times, before and after patients started CRRT. Patients who recovered renal function or transitioned to hemodialysis experienced a positive outcome, while patients who transitioned to hospice or expired experienced a negative outcome. b Schematic of the machine learning pipeline. Training, tuning, and validation were performed on a 60/20% split of the dataset, with the remaining 20% as a holdout test set. External testing was performed on any unseen cohort. c Schematic of windowing of longitudinal features. Features were aggregated over a w day window before the first day of CRRT. The features were used to predict the outcome, regardless of the number of days on CRRT.

