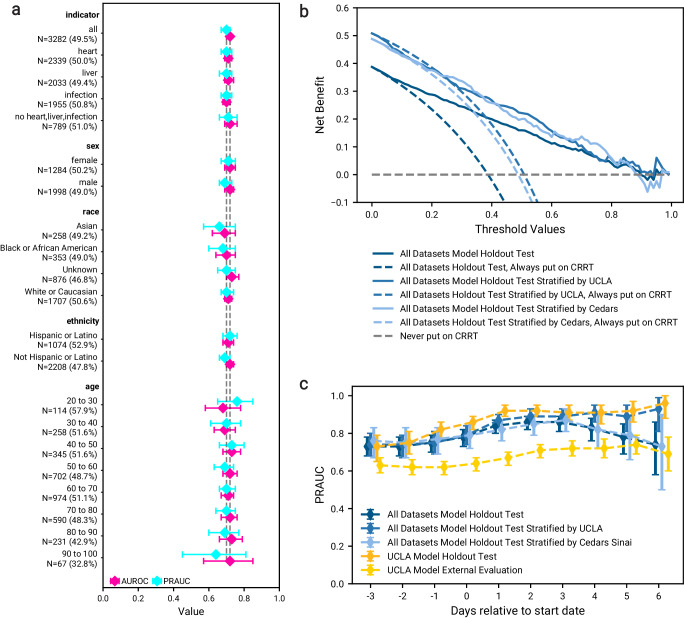
Fig. 5. Additional analyses and evaluation.
a Performance after training on a combination of UCLA: CRRT, Cedars: CRRT, and UCLA: Control cohorts (N = 2999), measured by ROCAUC (pink) and PRAUC (blue) on a holdout test set (N = 3282) including patients who were on CRRT for more than seven days (model defined in Section “Evaluation of model performance”). Results are also reported when applying the model to subgroups of the test set, categorized by disease indicator, sex, race, ethnicity, and age. Reported statistics include point estimates as well as 95% confidence intervals obtained from 1000 bootstrap iterations of the test dataset. b Decision curve analysis illustrating net benefit at different operating thresholds for the same models and datasets described in Fig. 2. c Evaluation of the same models and datasets described in 2, when using features from shifted windows relative to the start date. The observation window was shifted from three days before starting CRRT to six days after starting CRRT. The models were evaluated (without re-training) on the subset of test patients who had available features for each shifted window. Reported statistics include PRAUC as well as 95% confidence intervals obtained from 1000 bootstrap iterations of the test dataset. Source data are provided as a Source Data file.

